Understanding Ecommerce Reports in GetResponse
GetResponse provides powerful ecommerce reporting tools to help you track the effectiveness of your marketing efforts. Whether you’re monitoring abandoned carts, conversion performance, or order revenue, you’ll find comprehensive insights across multiple report panels.
Accessing reports
To see ecommerce statistics:
- Go to Reports.
- Click Ecommerce on the left panel.
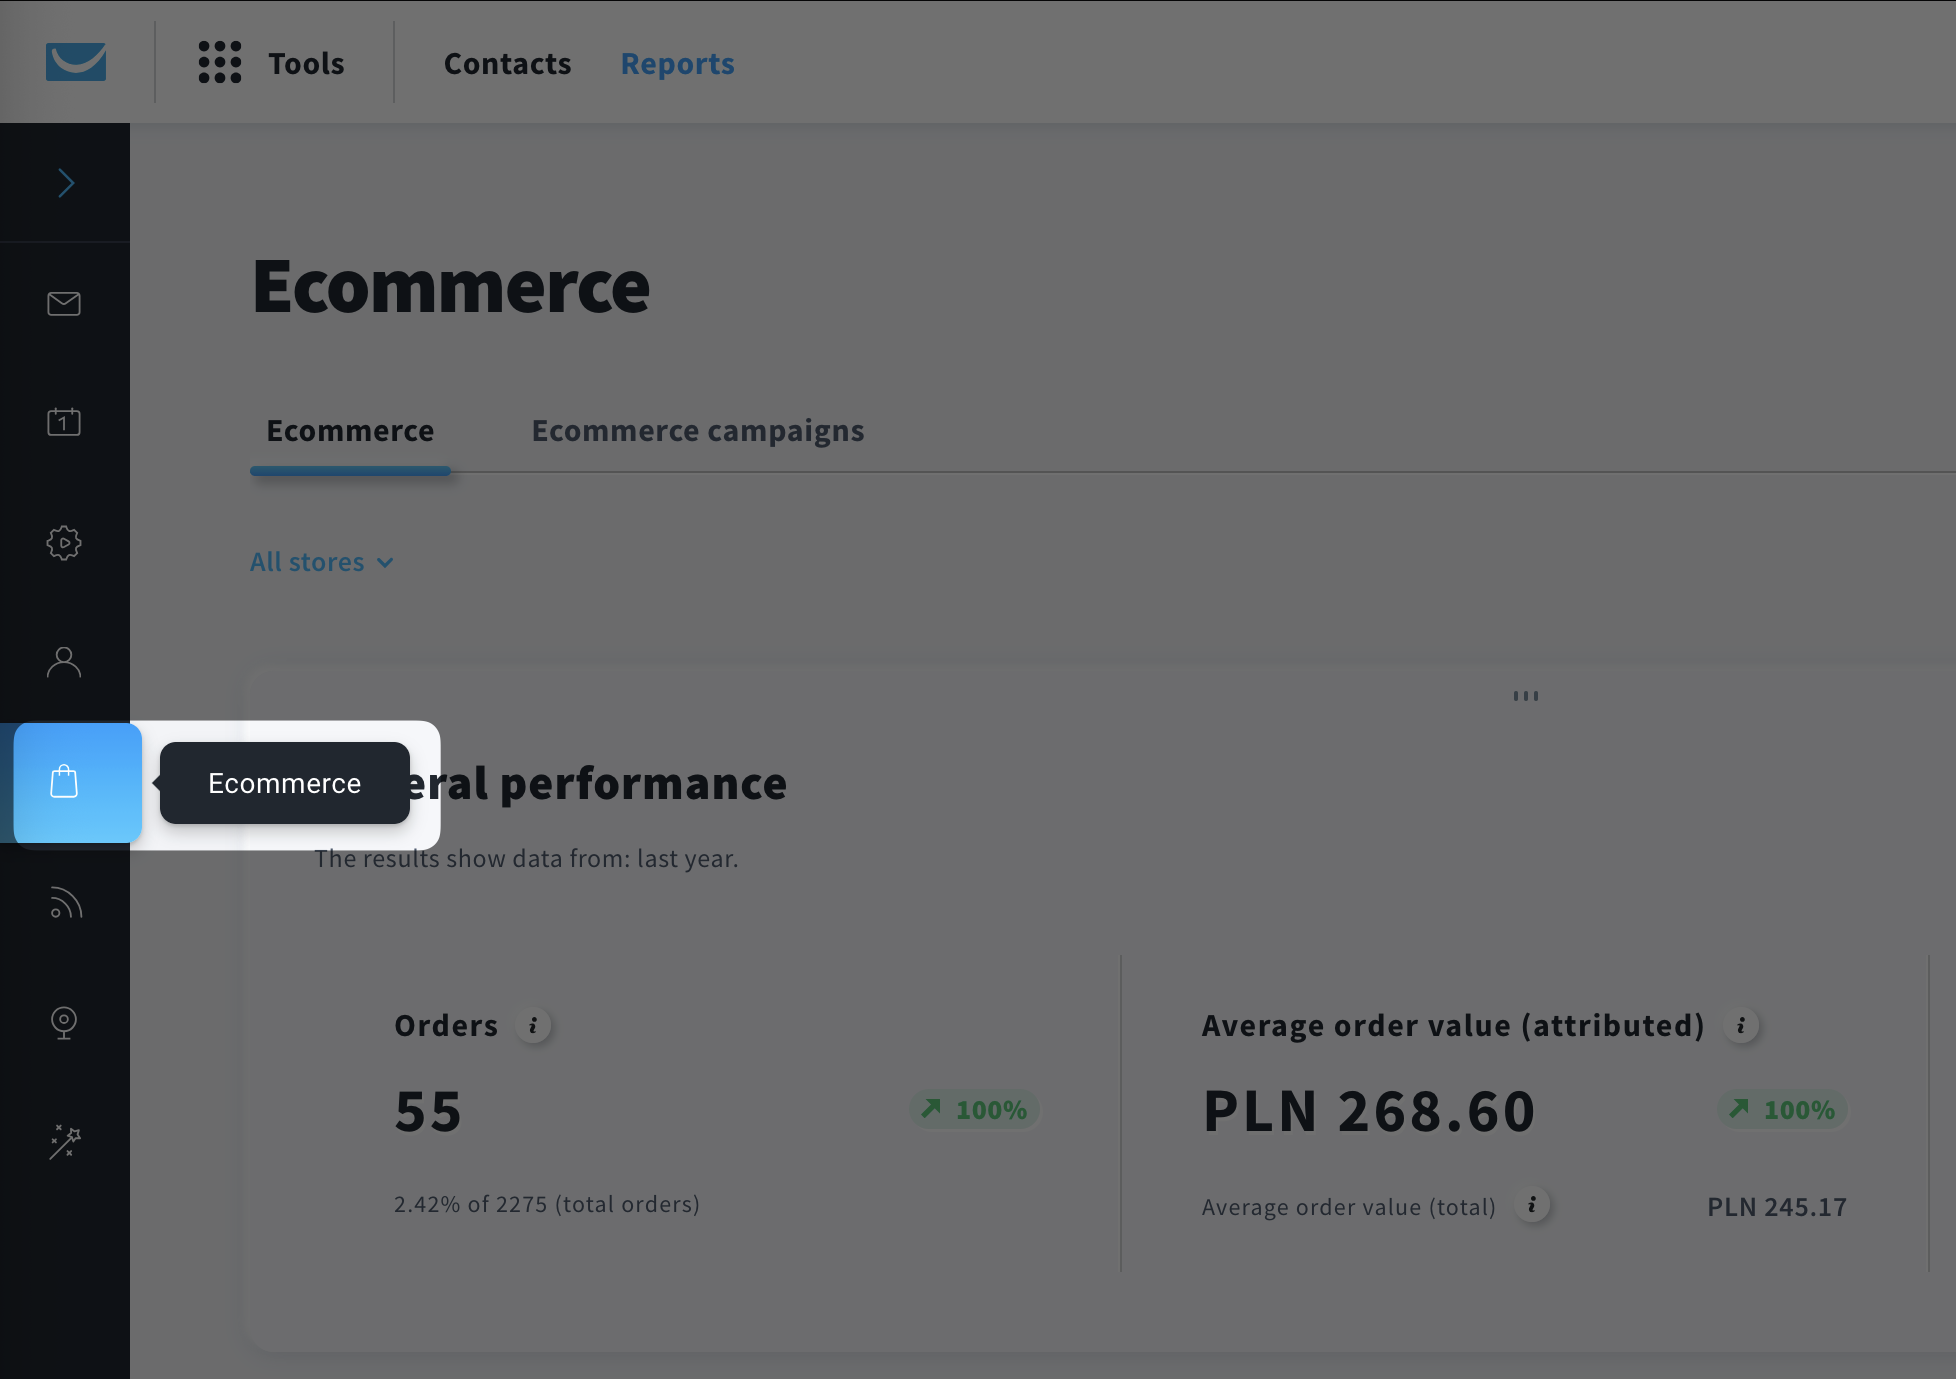
- To see the statistics, click one of the two tabs:
- Ecommerce – statistics based on orders created within the selected store integrated with GetResponse, and the selected time period
- Ecommerce campaigns – statistics based on ecommerce campaigns created by you
IMPORTANT: Only orders with the PAID status are included in revenue. Statuses can be mapped accordingly in your store settings in Tools > Ecommerce tools > Store settings > Order statuses.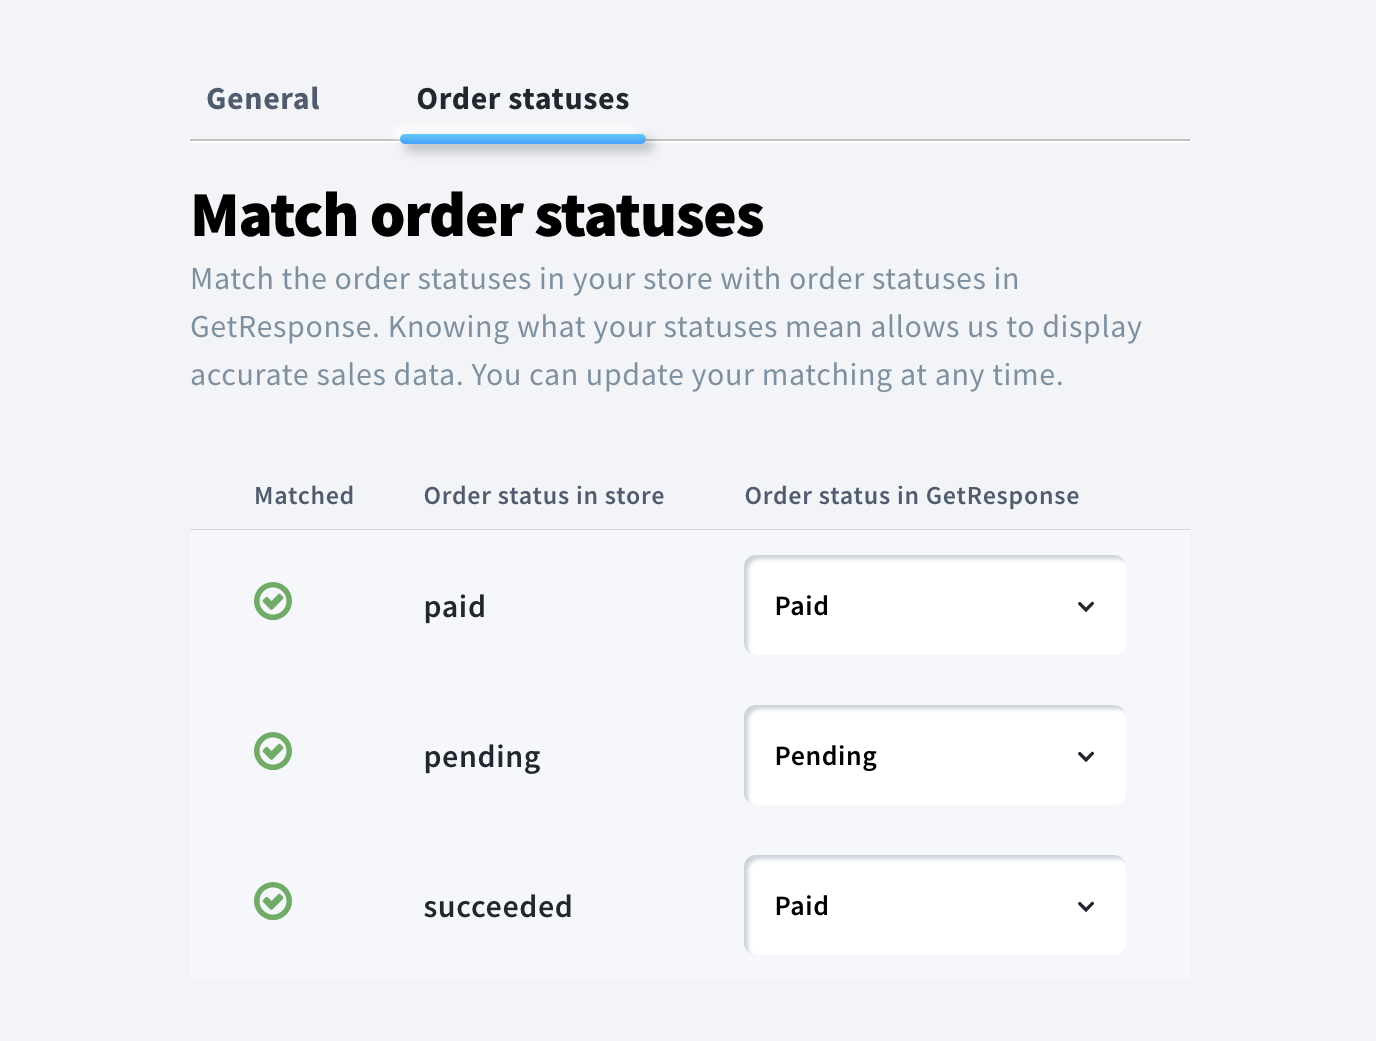
Ecommerce
This section focuses on orders created within the selected date range and selected store. You can select one, multiple, or all stores in the dropdown menu.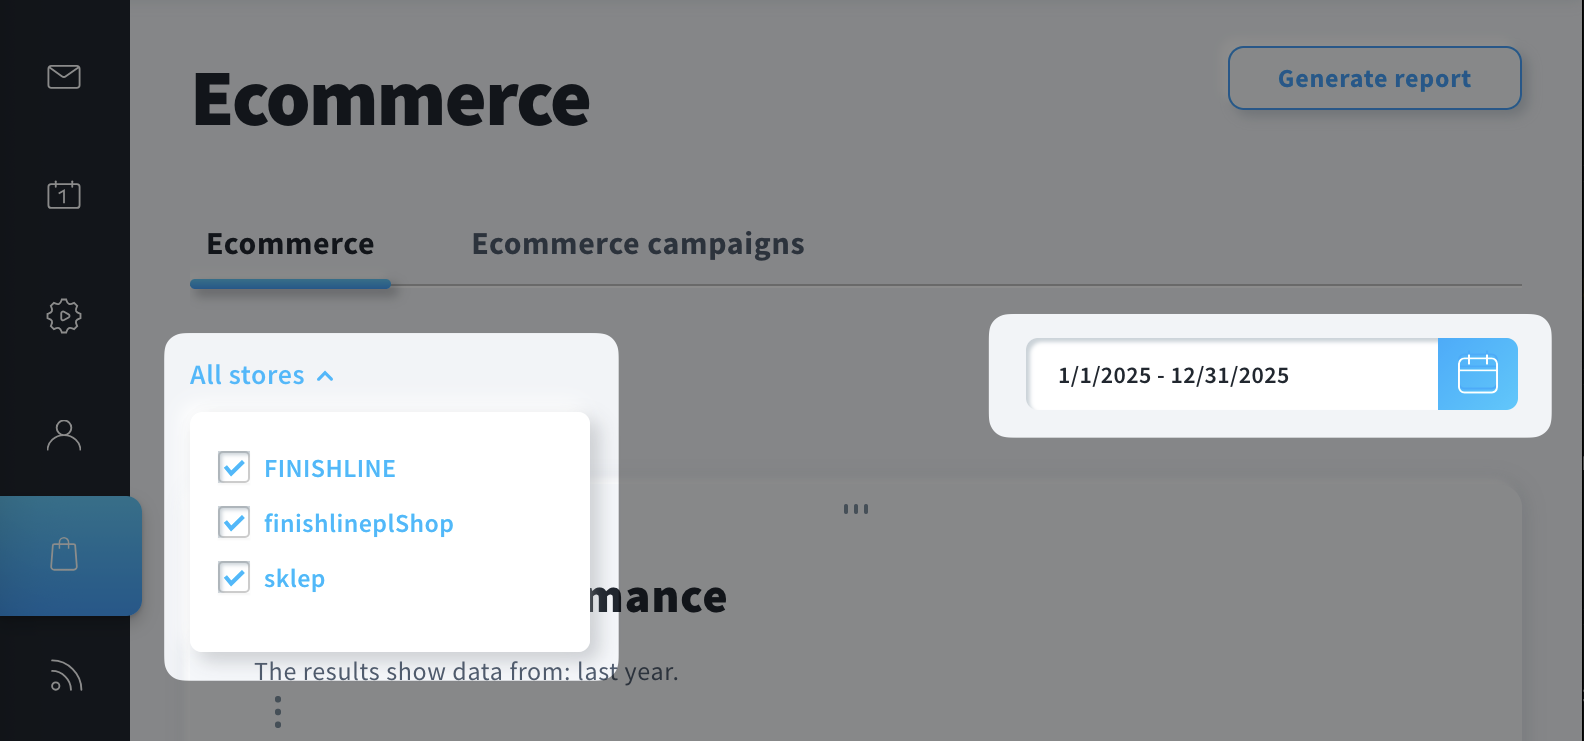
After selecting the stores and the date range, the results will be displayed across multiple sections.
General Performance
Displays metrics for paid orders originating from selected date range and store.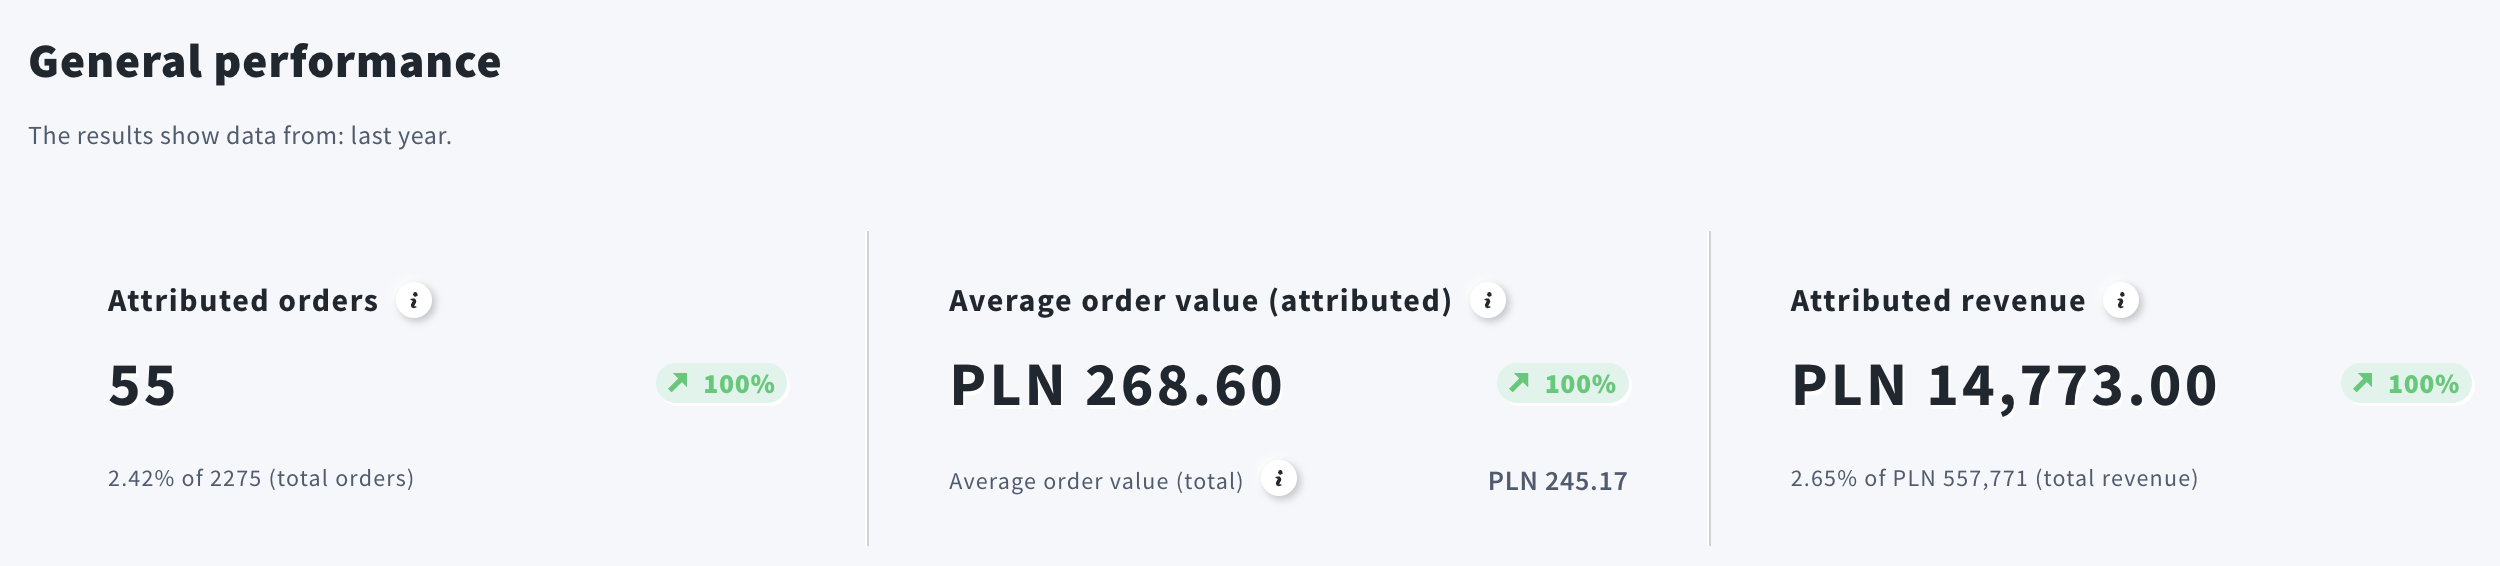
You can find the exact calculations behind those numbers below.
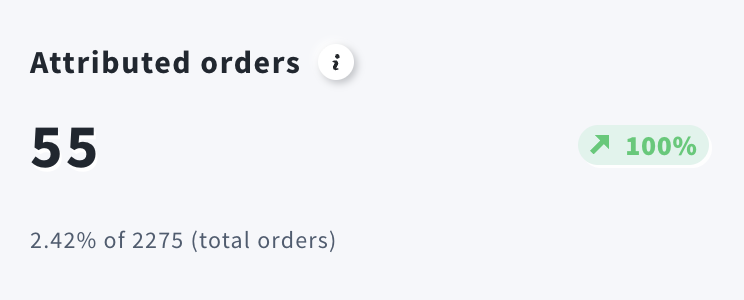
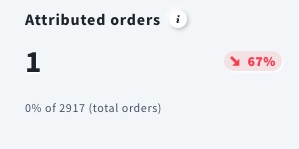
Attributed orders is the total number of paid orders from the selected stores within the chosen time period.
Orders trend indicator shows whether the number of orders increased or decreased in the selected period compared to the previous one.
Order conversion rate shows the percentage of paid orders from the selected stores and selected time period relative to all paid orders.
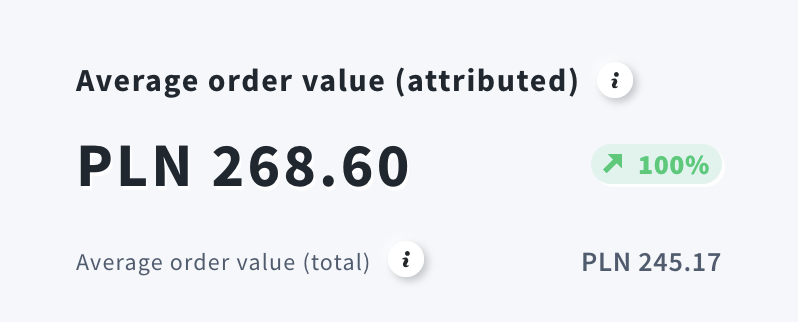
Average order value (attributed) is the attributed revenue divided by the number of attributed orders. It shows the average amount customers spend per order influenced by GetResponse. Use this metric to evaluate pricing and the impact of strategies like cross-selling, discounts, and free shipping.
Average order value trend shows whether your average order value increased or decreased compared to the previous period. AOV is most commonly tracked on a monthly basis.
Average order value (total) is total revenue divided by the total number of orders. It shows the average amount customers spend per order.
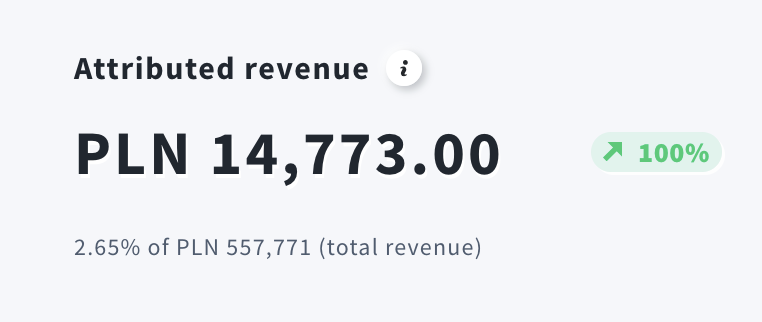
Attributed revenue is the value of sales generated by your emails within the selected period, based on the store’s attribution window.
Attributed revenue trend shows the percentage increase or decrease in attributed revenue compared to the previous period.
Attributed revenue conversion rate shows the percentage of attributed revenue from the selected stores and time period compared to total revenue.
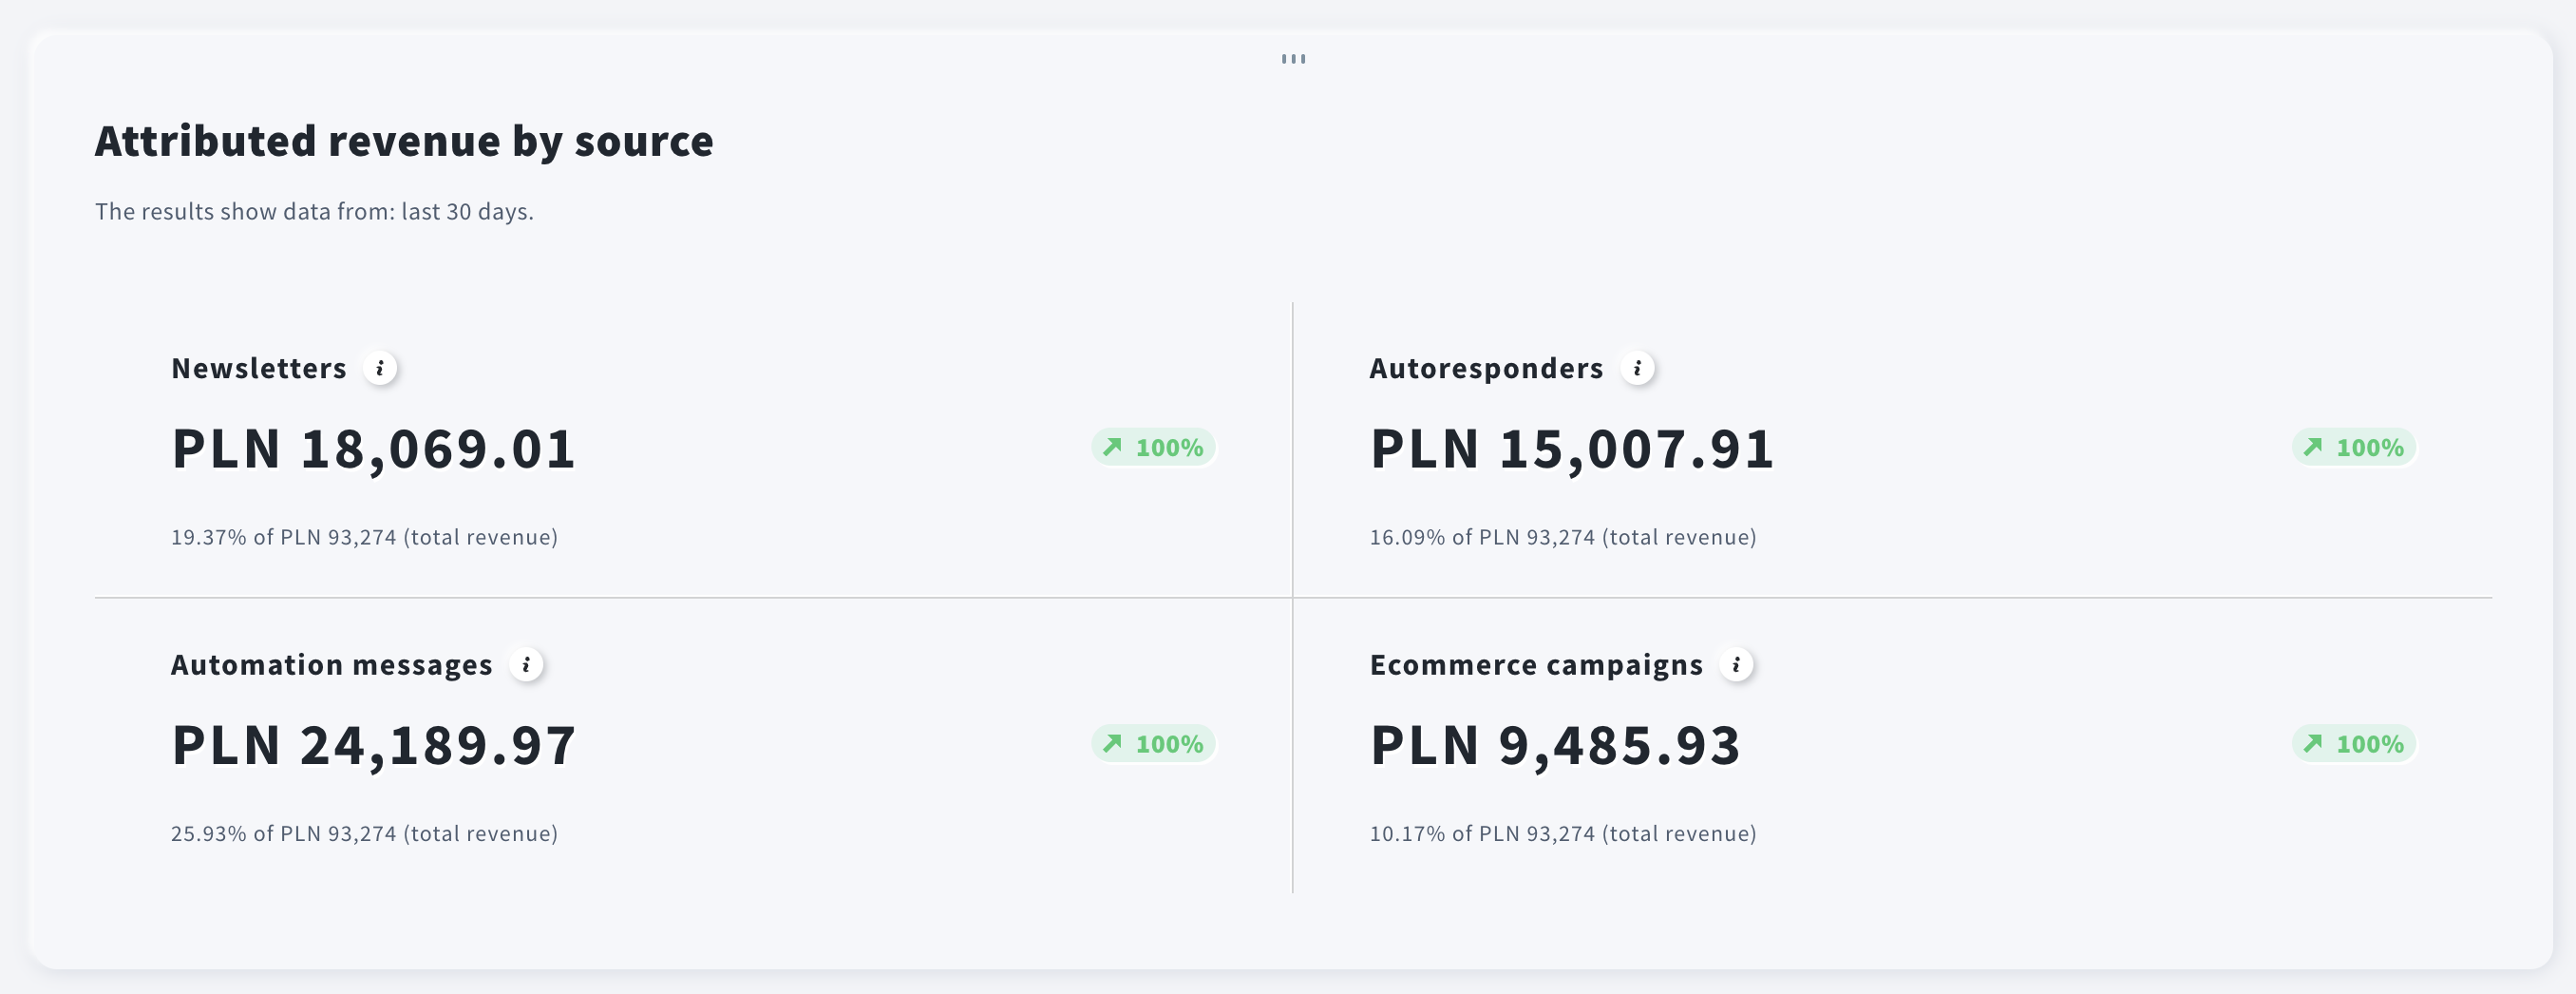
Attributed revenue by source
Displays metrics related to attributed revenue, broken down by message type, in the selected time range.
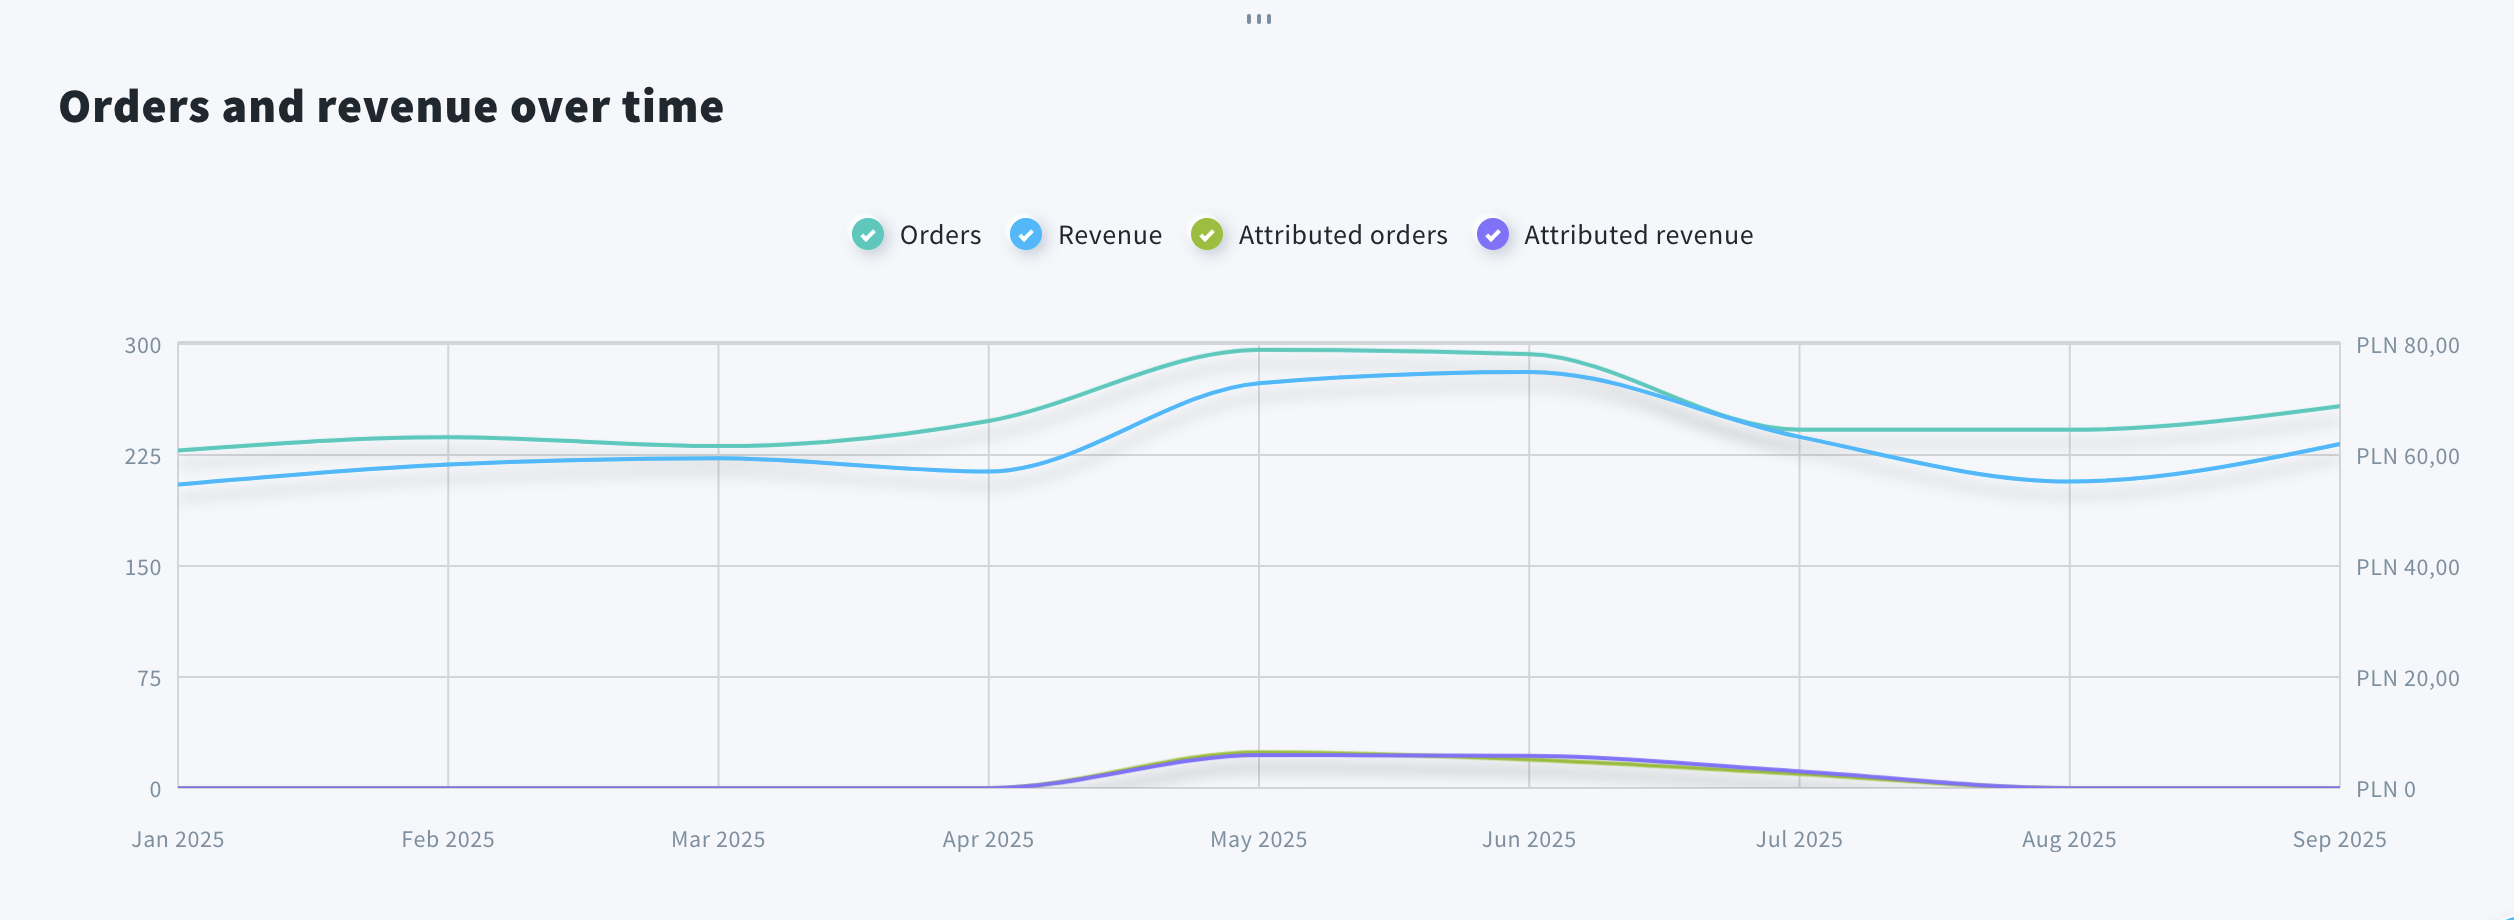
Orders and revenue over time
Here you can see a chart to track order and revenue trends visually over a timeline. You can find four lines on the graph (you can show/unshow them by clicking on their names):
- Orders refer to all paid orders
- Revenue means the total revenue from all orders
- Attributed orders are paid orders converted with the help of GetResponse
- Attributed revenue is the revenue from attributed orders
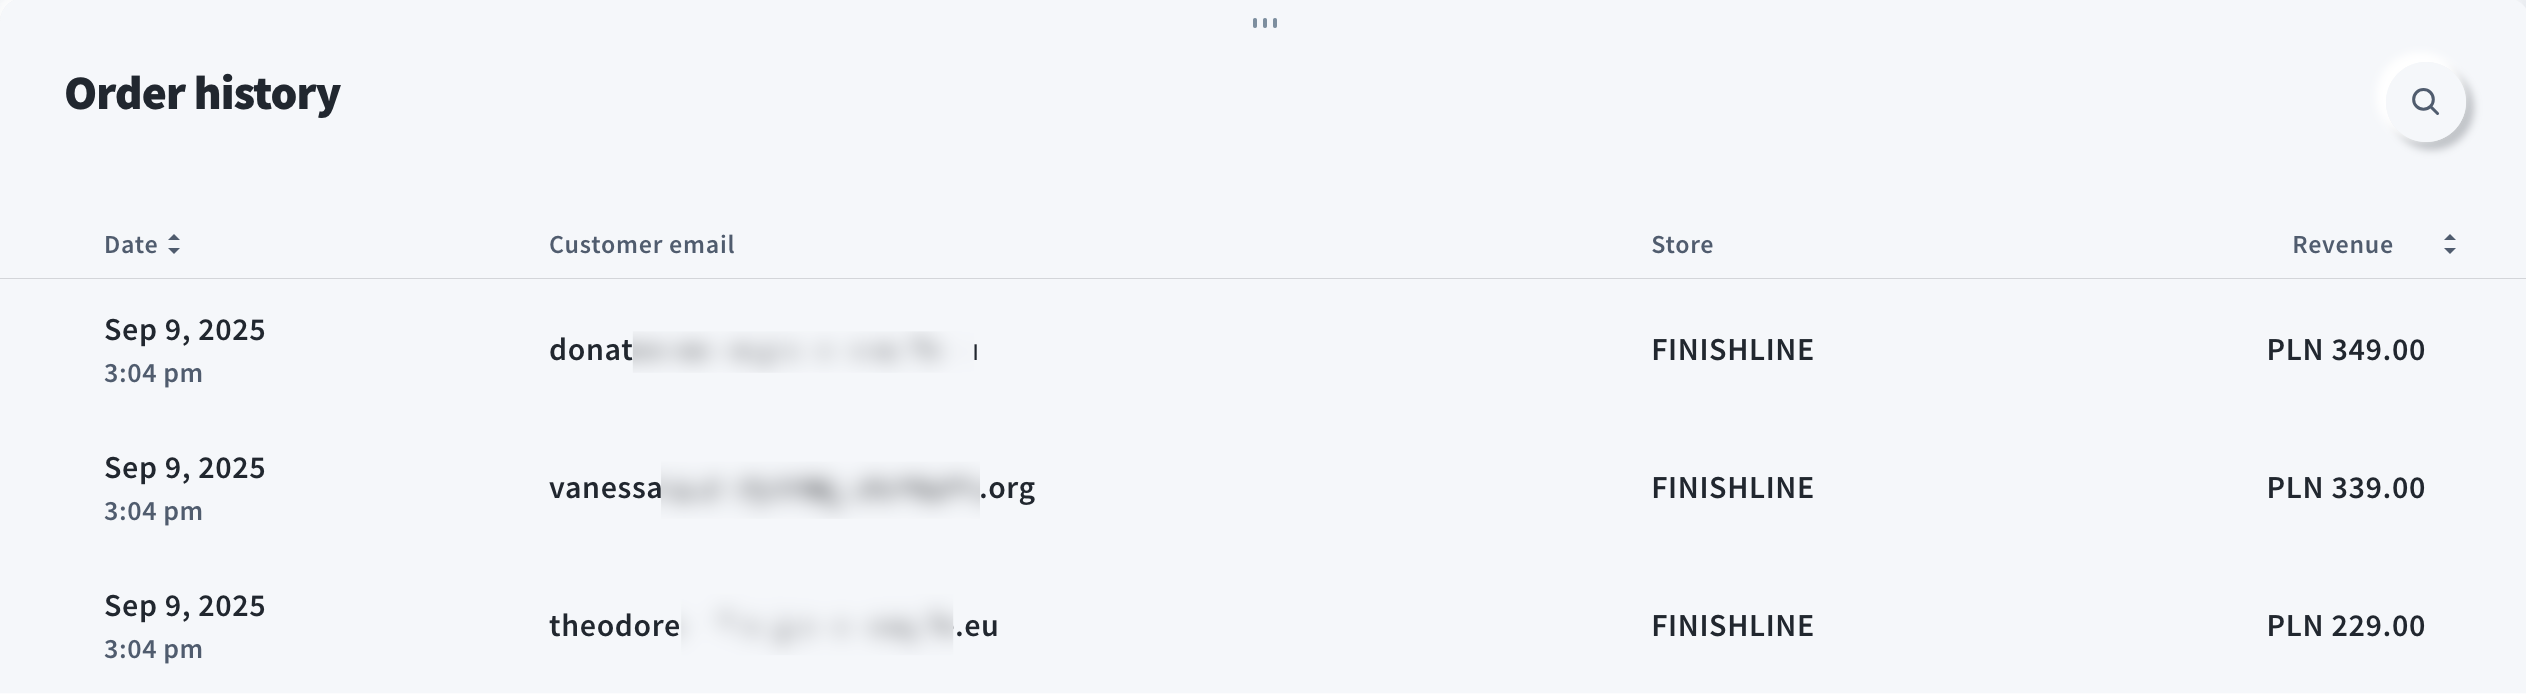
Order history
This is a complete list of All Orders placed within the selected time range. It contains the order date, customer’s email, store name, and the revenue.
Ecommerce Campaigns
This tab focuses on data related to abandoned and recovered carts. The date range filters are based on when the cart was abandoned. An ecommerce campaign needs to be created first. You can select one or multiple campaigns.
General Performance
Displays metrics for paid orders originating from ecommerce campaigns.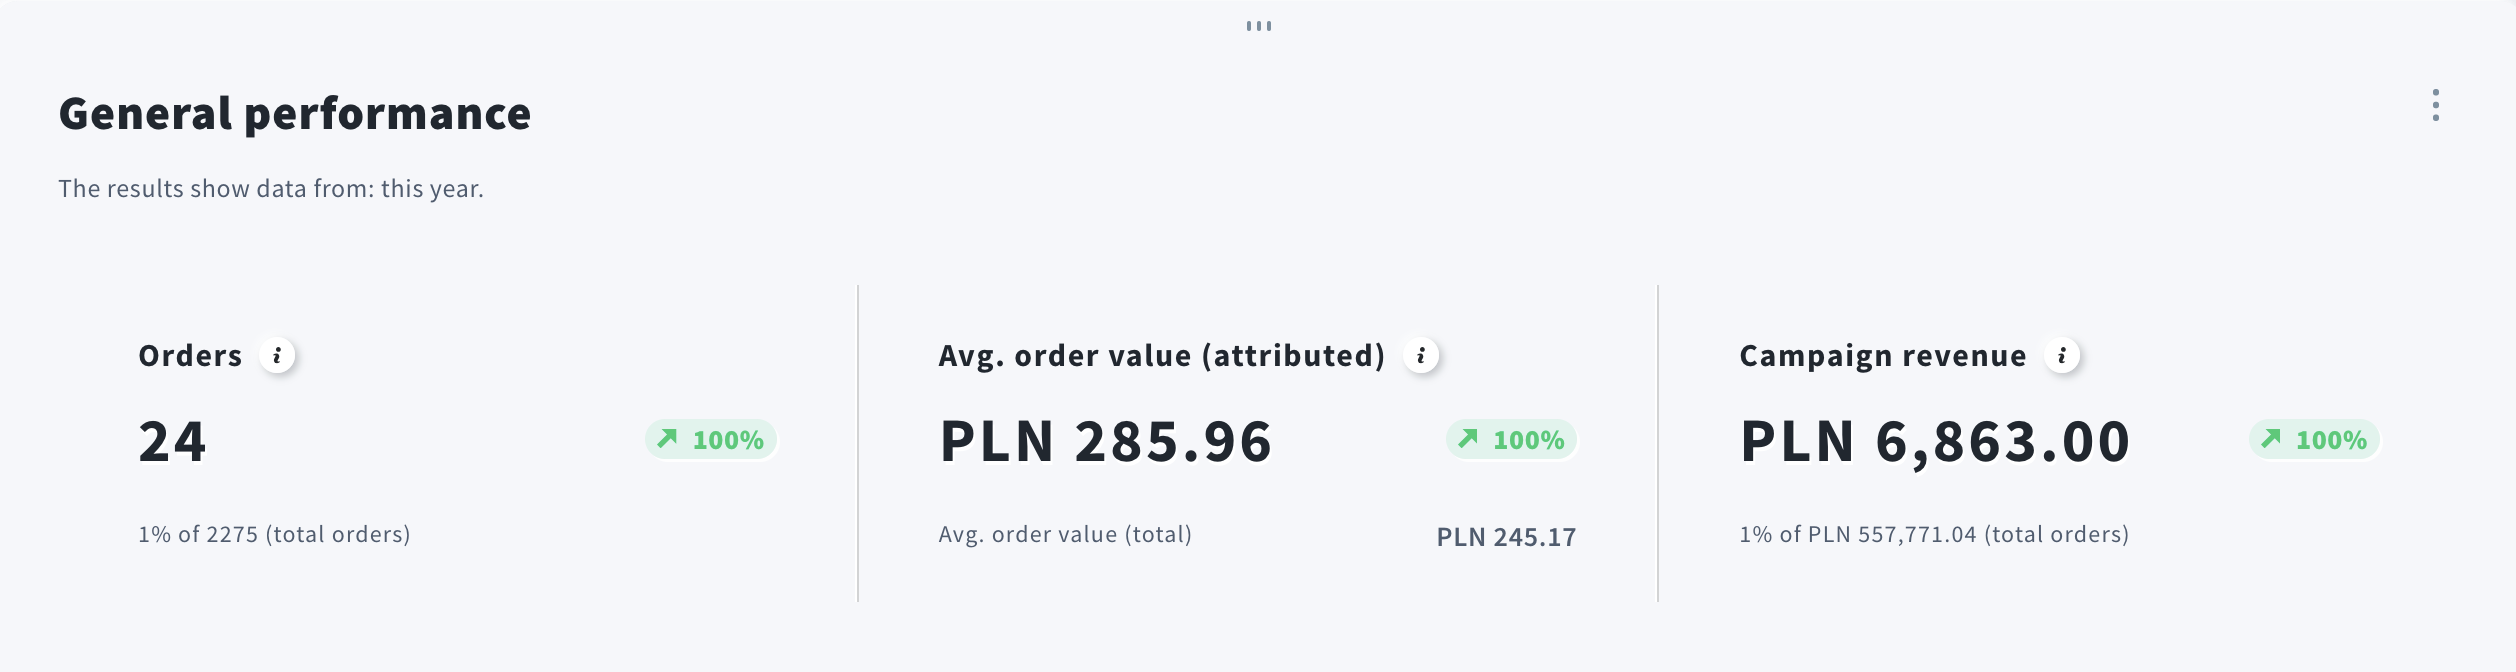
You find calculations behind those numbers below.
Attributed orders is the number of paid orders from selected ecommerce campaign(s) and time period.
Orders trend indicator shows whether the number of orders increased or decreased in the selected ecommerce campaign compared to a period preceding a campaign of the same duration.
Order conversion rate shows the percentage of paid orders from the selected ecommerce campaign and time period compared to all paid orders.
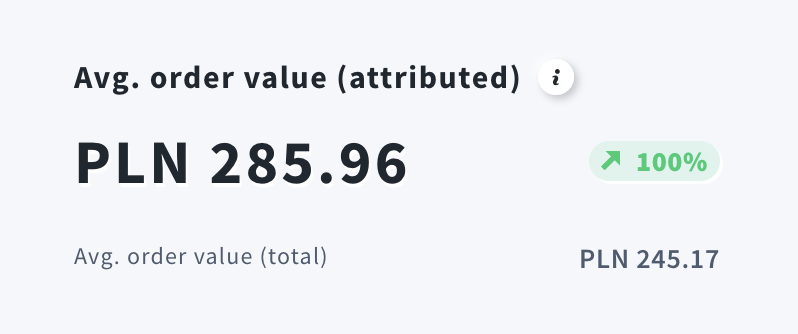
Avg. order value (attributed) is the total attributed revenue divided by the number of attributed orders – those converted through GetResponse. It shows the average amount spent per order. Use it to evaluate pricing and the impact of strategies like cross-selling, discounts, or free shipping.
Average order value trend shows whether your average order value increased or decreased compared to a period preceding a campaign of the same duration.
Avg. order value (total) is the total revenue divided by the total number of orders. It shows the average amount customers spend per order.
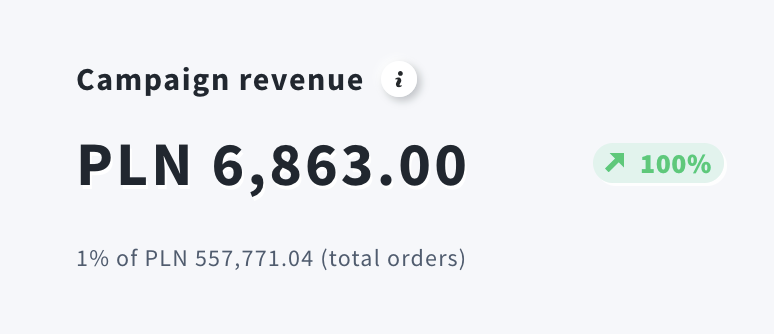
Campaign revenue is the total value of sales generated by your ecommerce campaign.
Campaign revenue trend shows the percentage increase or decrease in attributed revenue compared to a period preceding a campaign of the same duration.
Campaign revenue conversion rate shows the percentage of attributed revenue from the selected stores and time period compared to total revenue.
Campaigns
Provides an overview of each ecommerce campaign.
- Status is the current status of the campaign (it can be published, archived, or paused)
- Sent shows the number of messages sent (across all channels)
- Conversion shows the share of abandoned carts that were successfully recovered
- Revenue is the value of paid orders from recovered carts
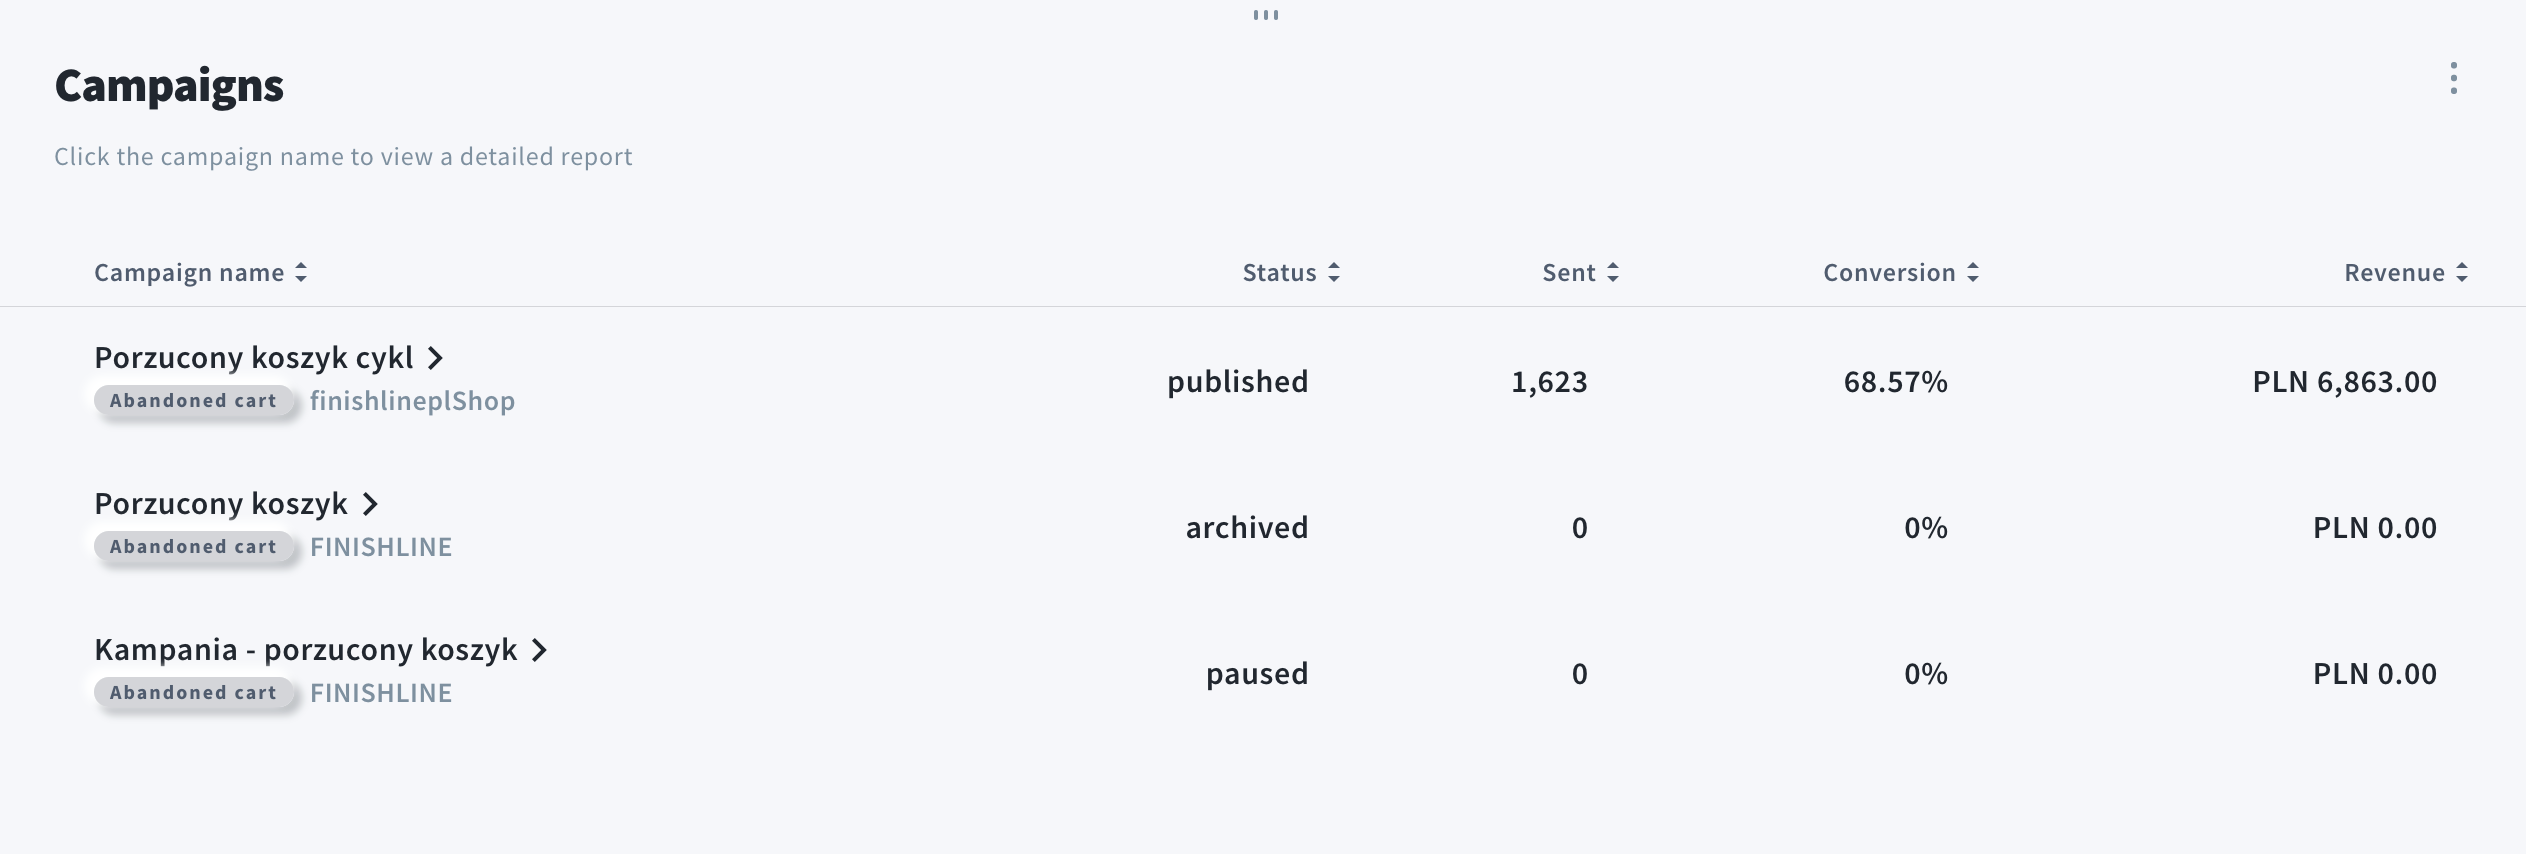
Chart designed to visually track the recovery performance of abandoned carts over a timeline. You can find three lines on the graph (you can show/unshow them by clicking on their names):
- Abandoned carts are carts linked to a campaign and marked as abandoned
- Recovered carts are abandoned carts that resulted in paid orders
- Revenue is the total revenue from recovered carts