Where to check course statistics?
By monitoring course statistics, you can gather valuable data to improve your courses, enhance learner engagement, and achieve better educational outcomes. You can find course statistics in several places, depending on the level of detail you need.
- Go to Tools > Courses.

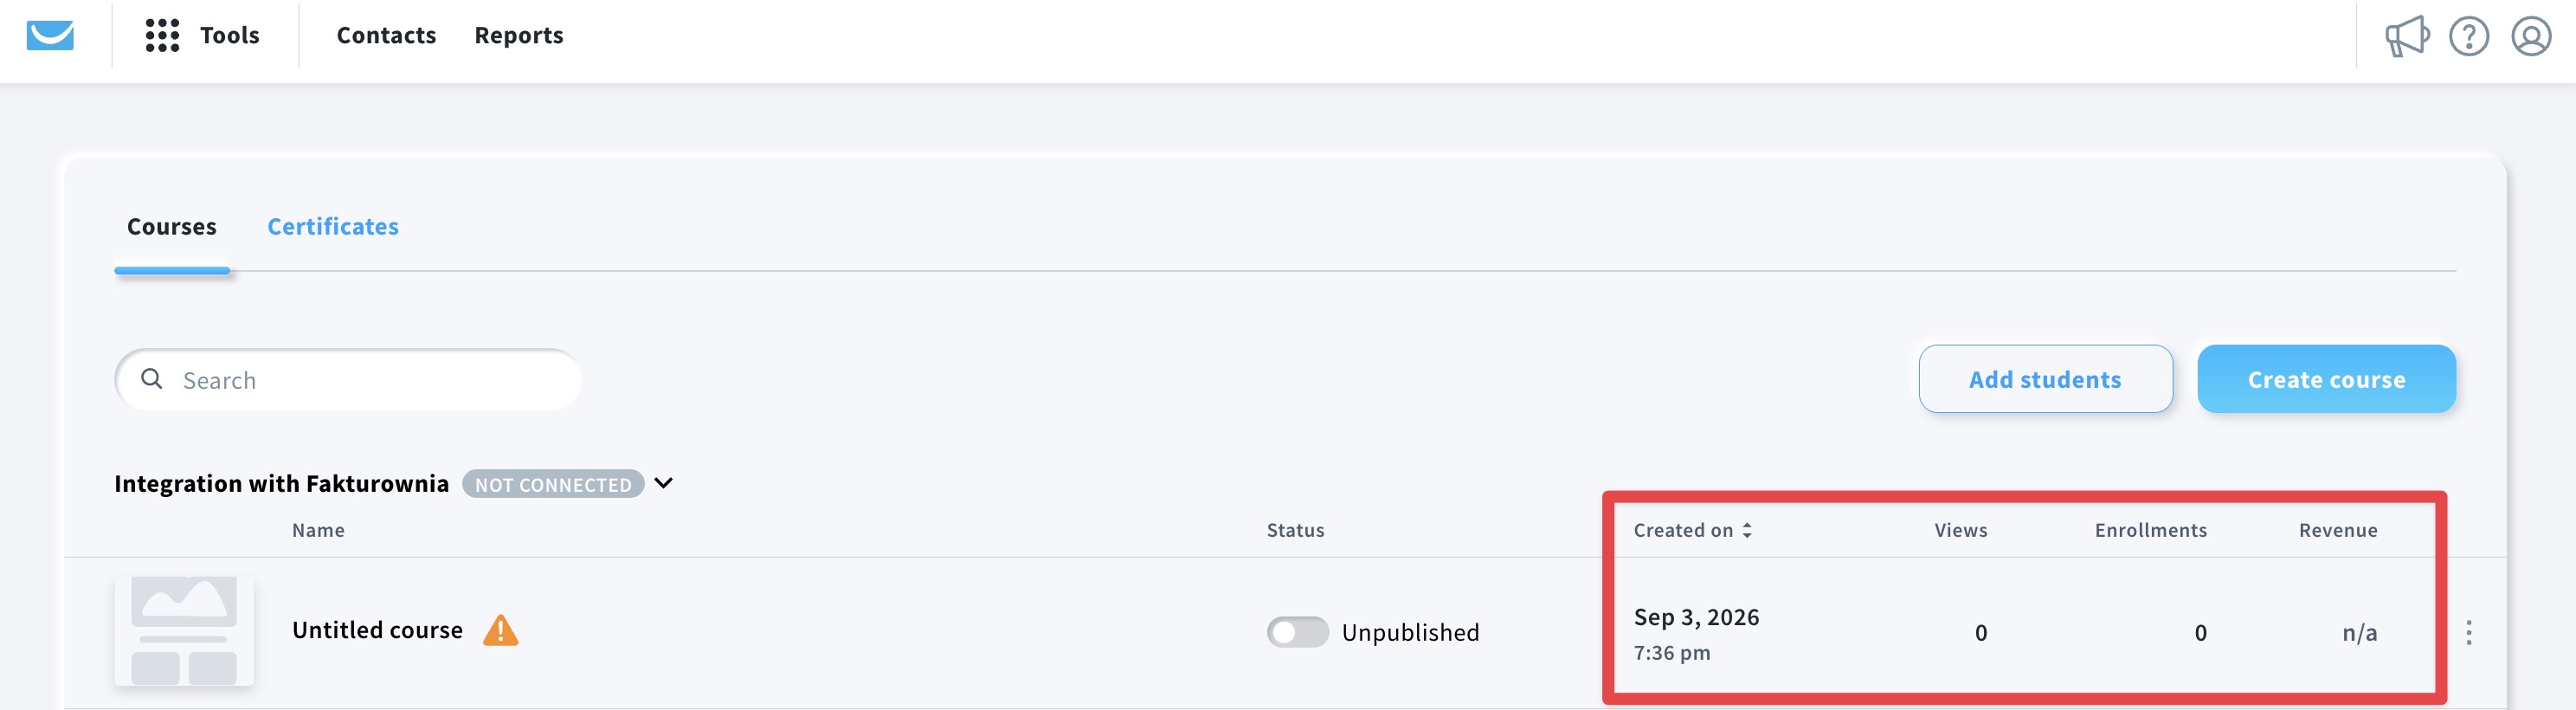
- On the Manage courses page, you can see basic statistics for each course, including its creation date, number of views and enrollments, and revenue.
- Locate your course and hover your mouse over the 3 dots on the right.

- Select Overview.

There you will see a detailed breakdown of your course statistics.
What information can I find under Overview
Overview is divided into 4 sections:
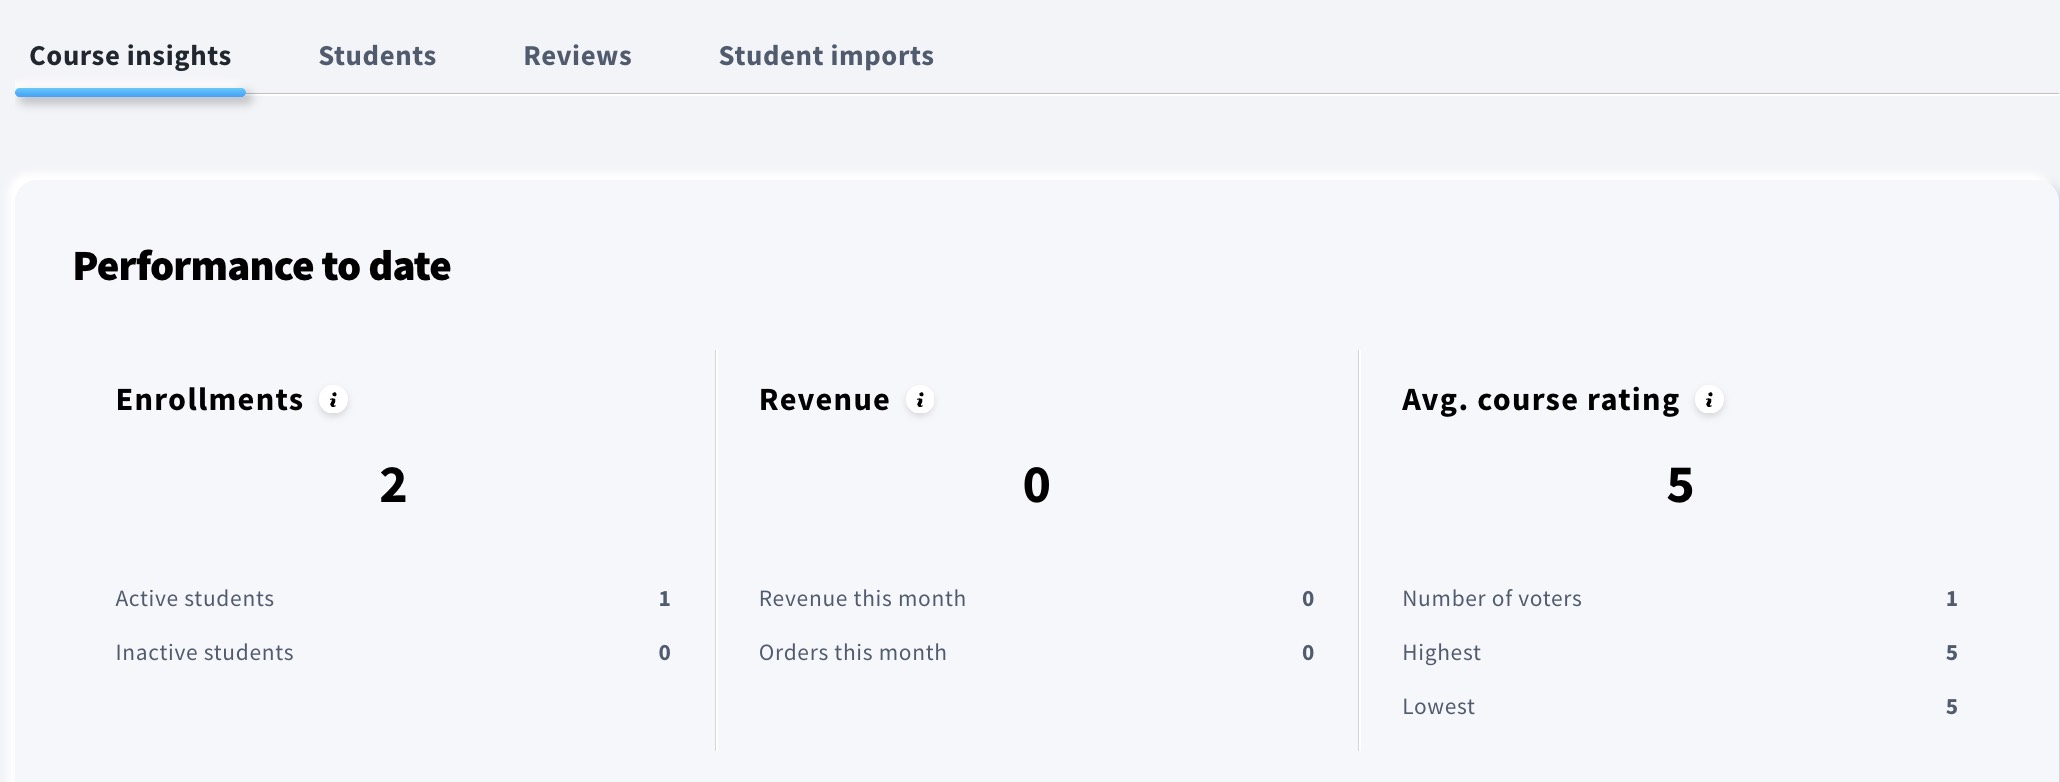
- Course insights: here you can see performance statistics, like enrollments (active and inactive students), revenue (revenue and orders for this month), and an average course rating (number of votes, highest and lowest rating).
Scroll down to see charts with the above statistics (enrollment over time, student engagement, revenue over time, and orders over time). Select the time period you want to include in the charts.

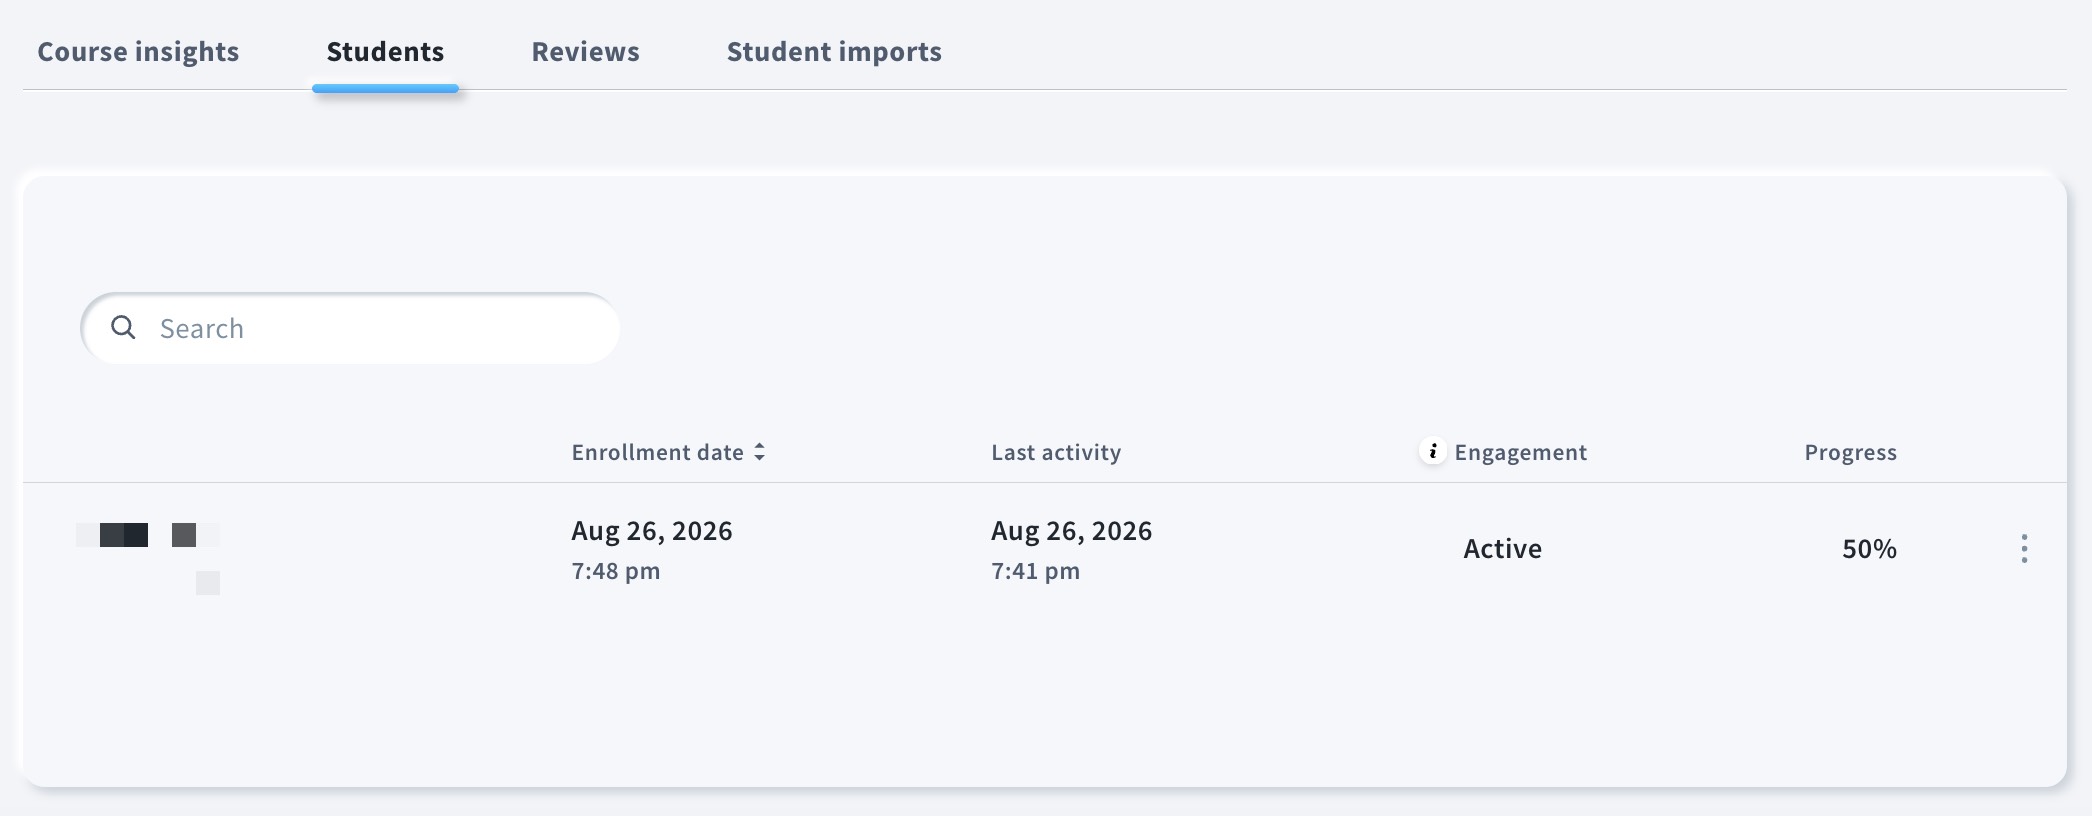
- Students: here you can check your students’ activity (enrollment date, latest activity, engagement and progress).
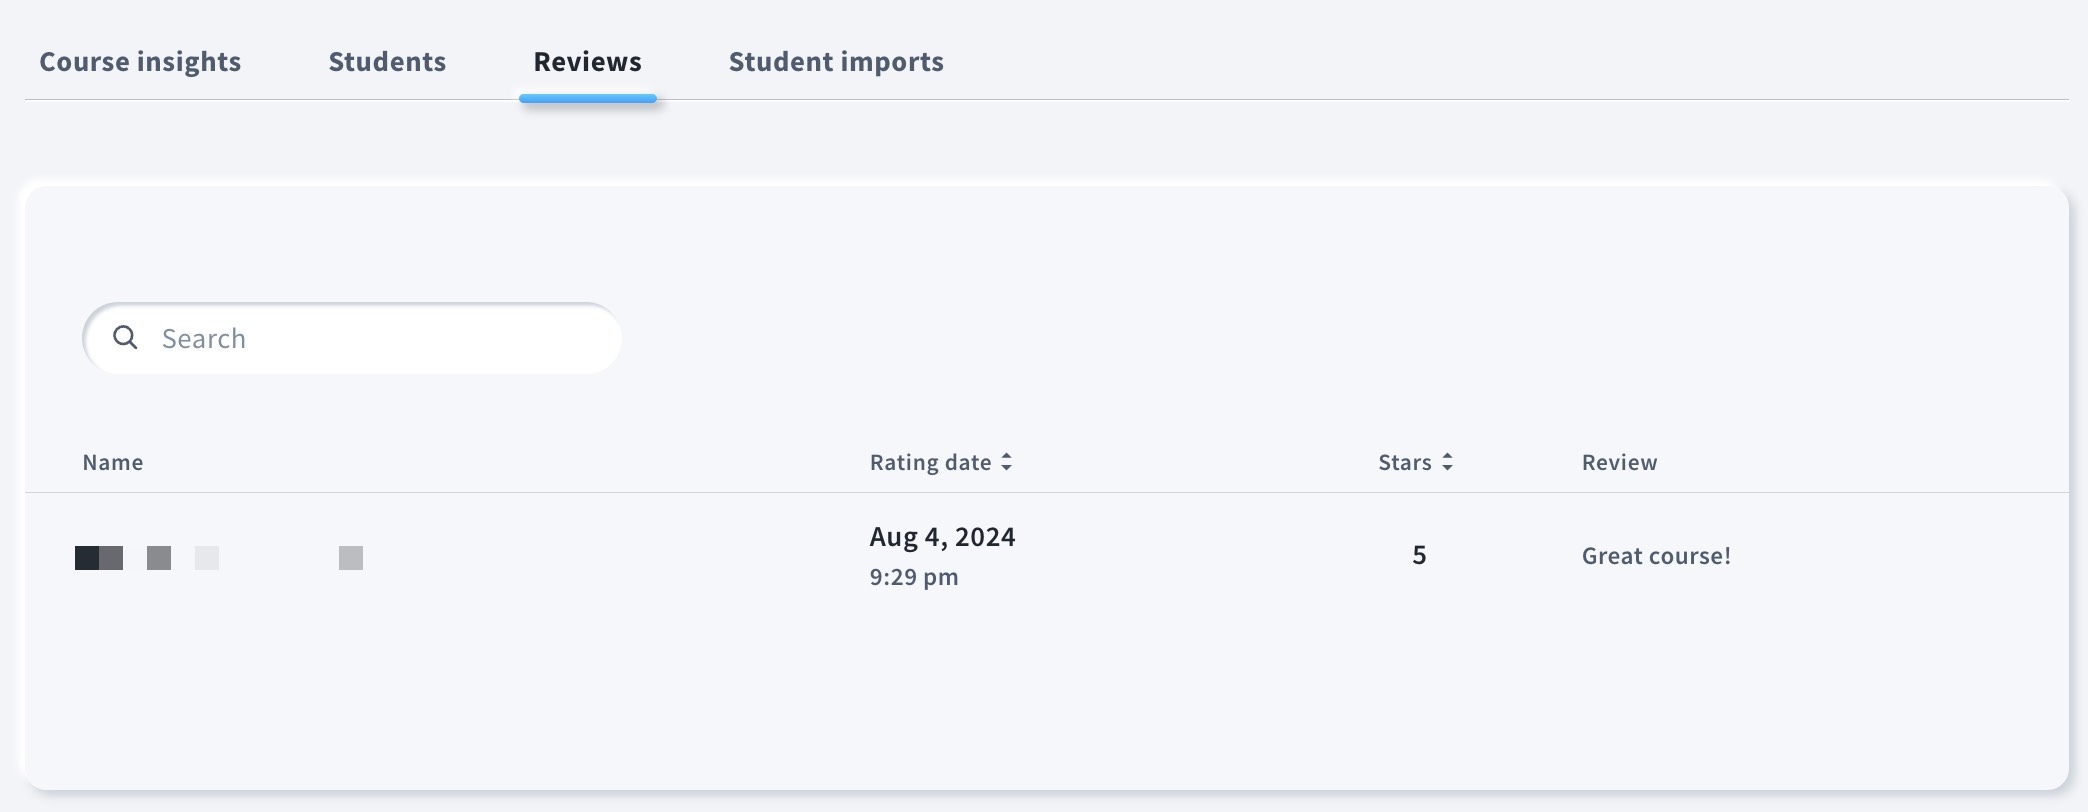
- Reviews: here you can check who left a review, how many stars they gave the course, and their comment.
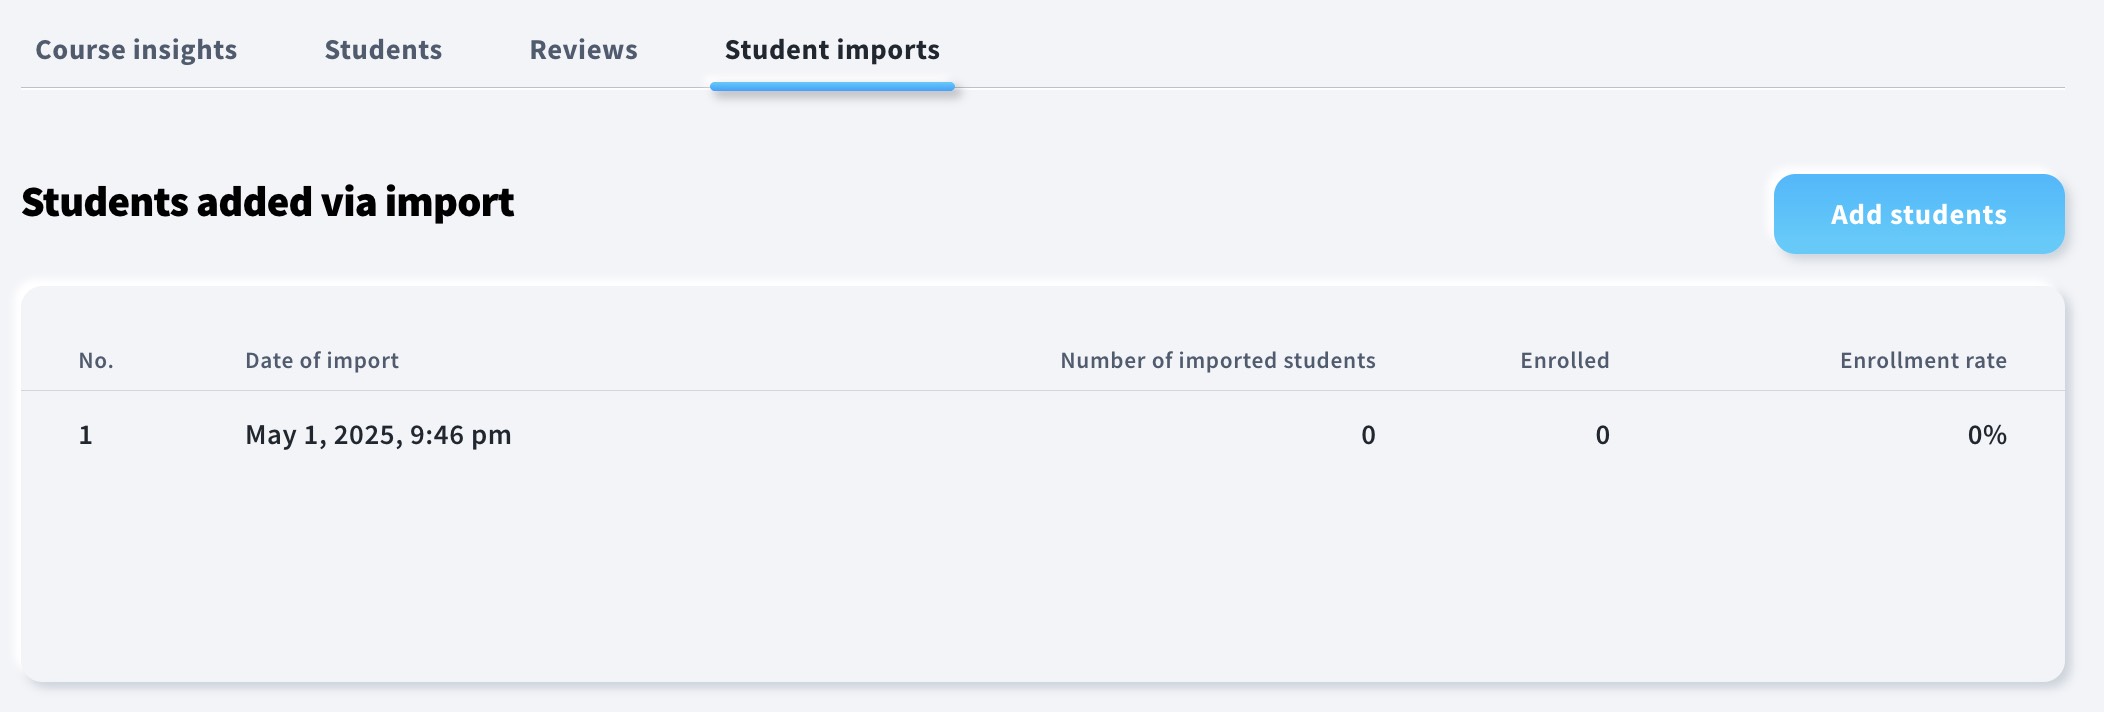
- Student imports: here you can see statistics for past student imports, including the import date, number of imported students, number of enrolled students, and enrollment rate.
What information can I find under Reports
You can also view more detailed course statistics in Reports.
- Go to Reports.
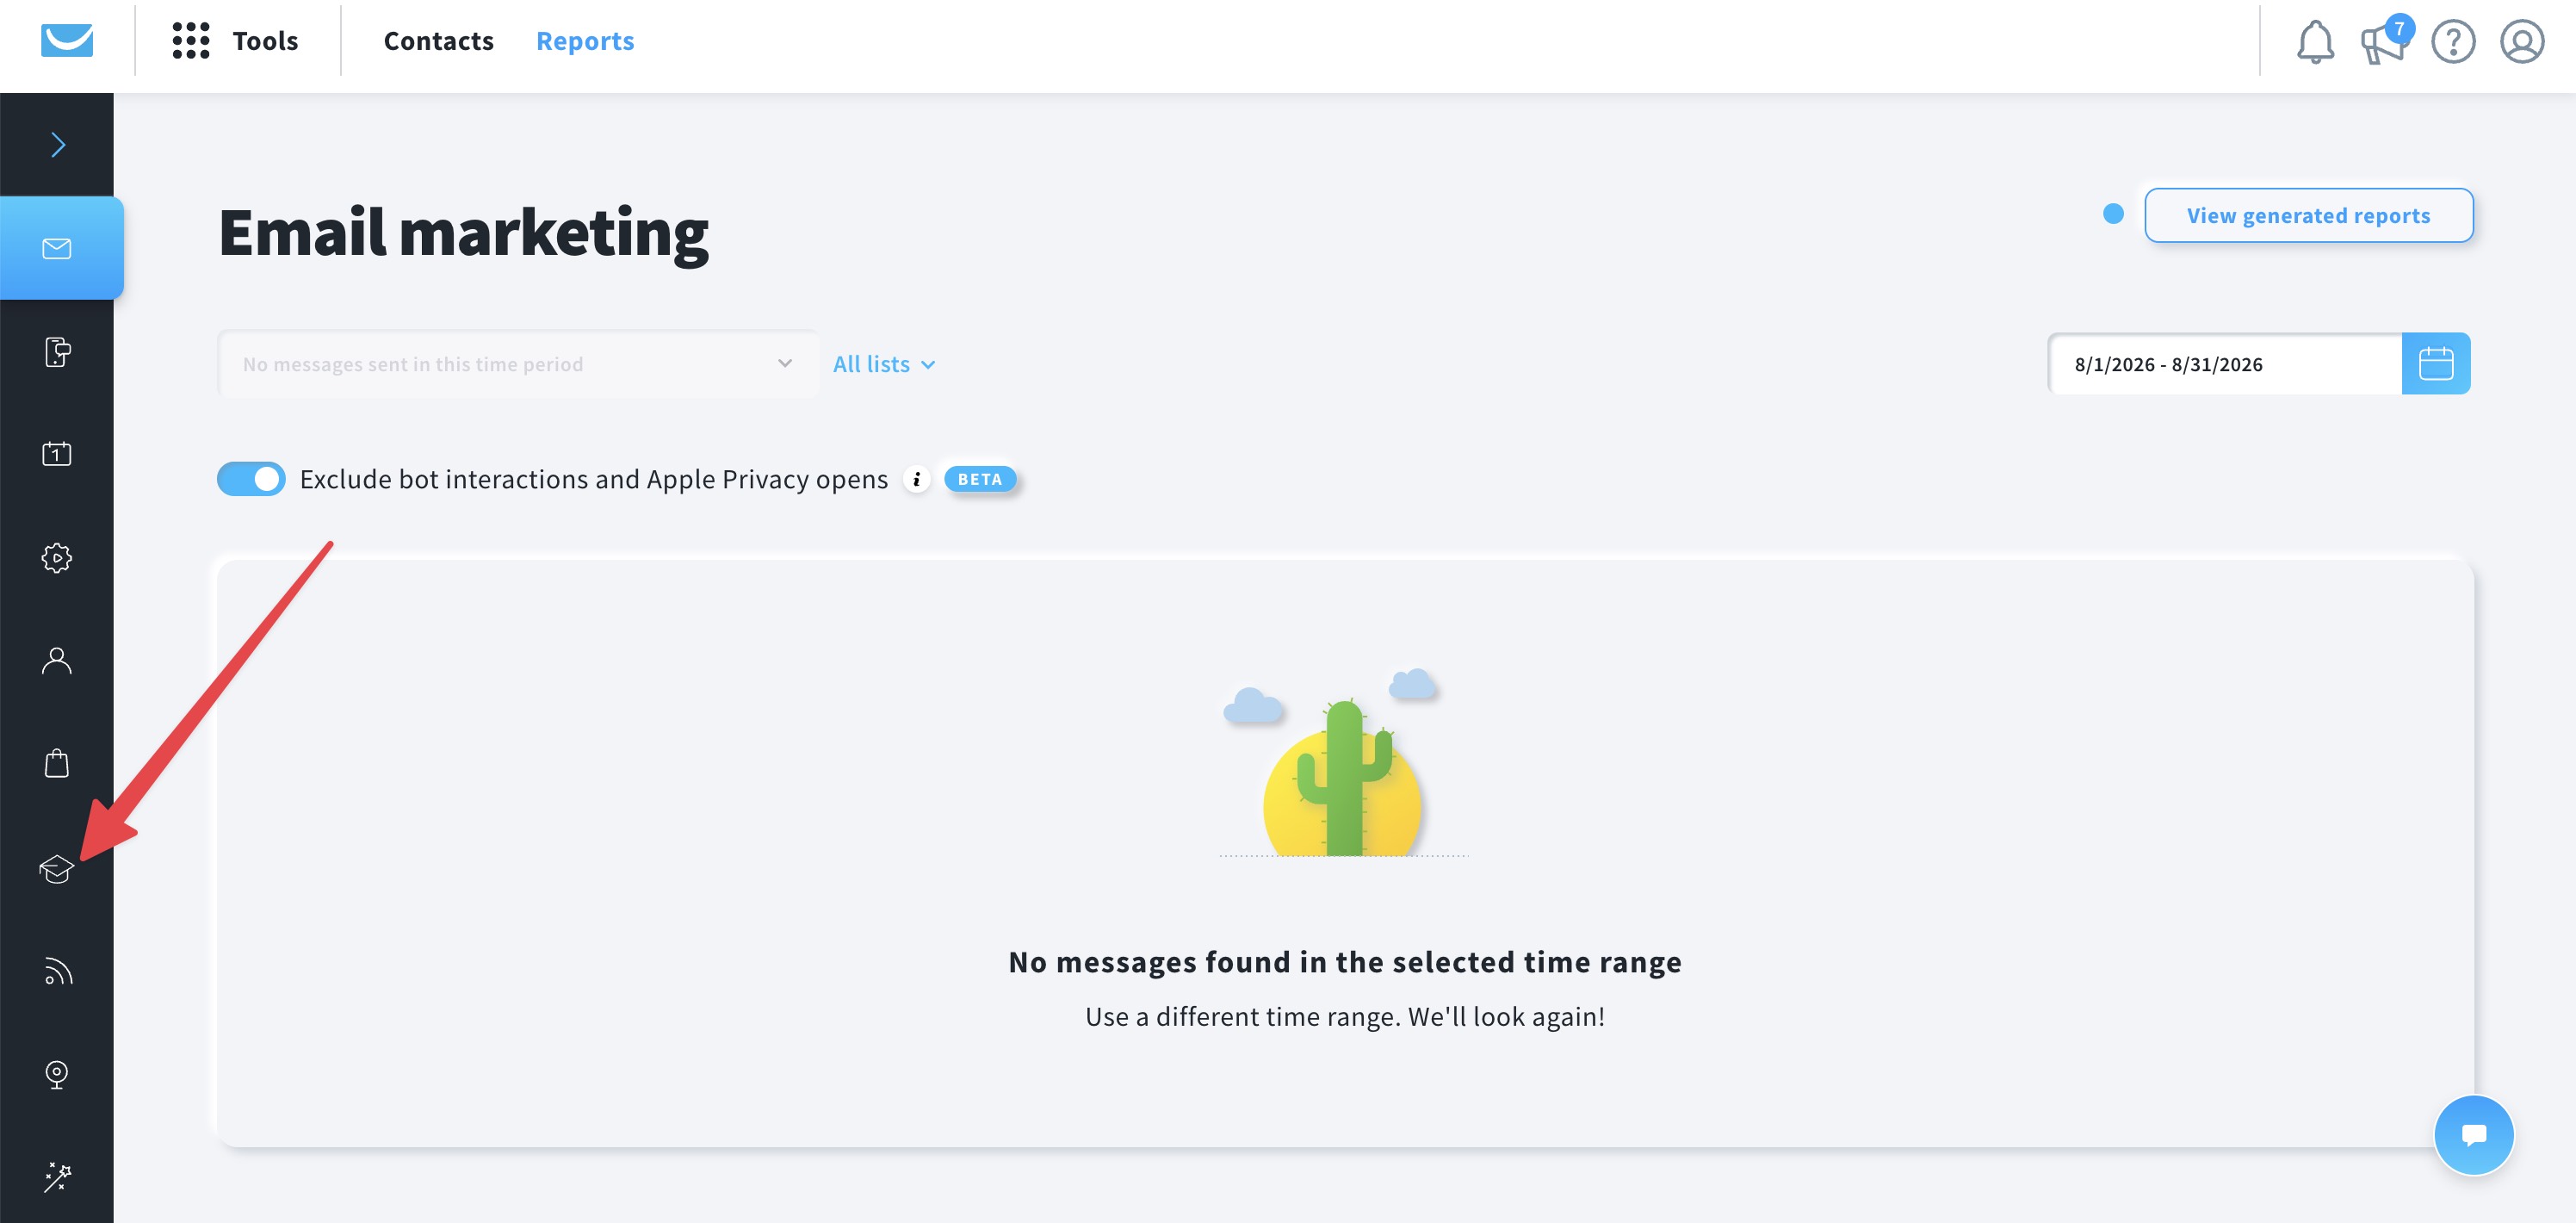
- Select Courses from the left sidebar.
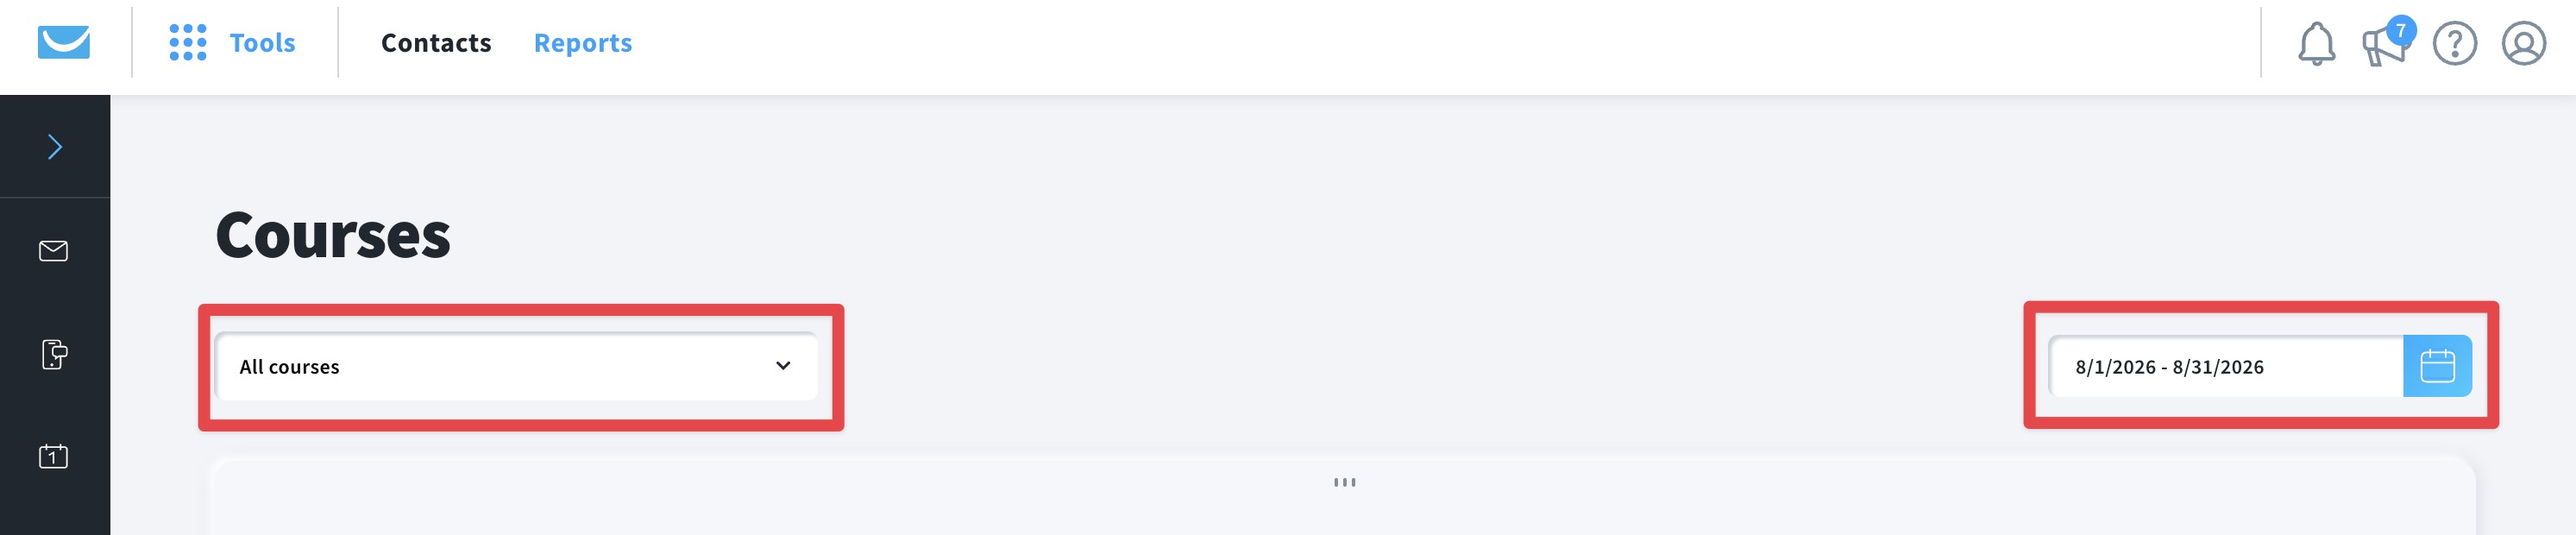
- Select the time range and the courses you want to include in the statistics.
The reports include the following sections:
- General performance: here you can see key statistics for the selected period, including active students, total students, course page visits, new enrollments, sales, and revenue.
Active students are students who accessed the course during the selected period, while total students includes all students enrolled during the selected period, both active and inactive.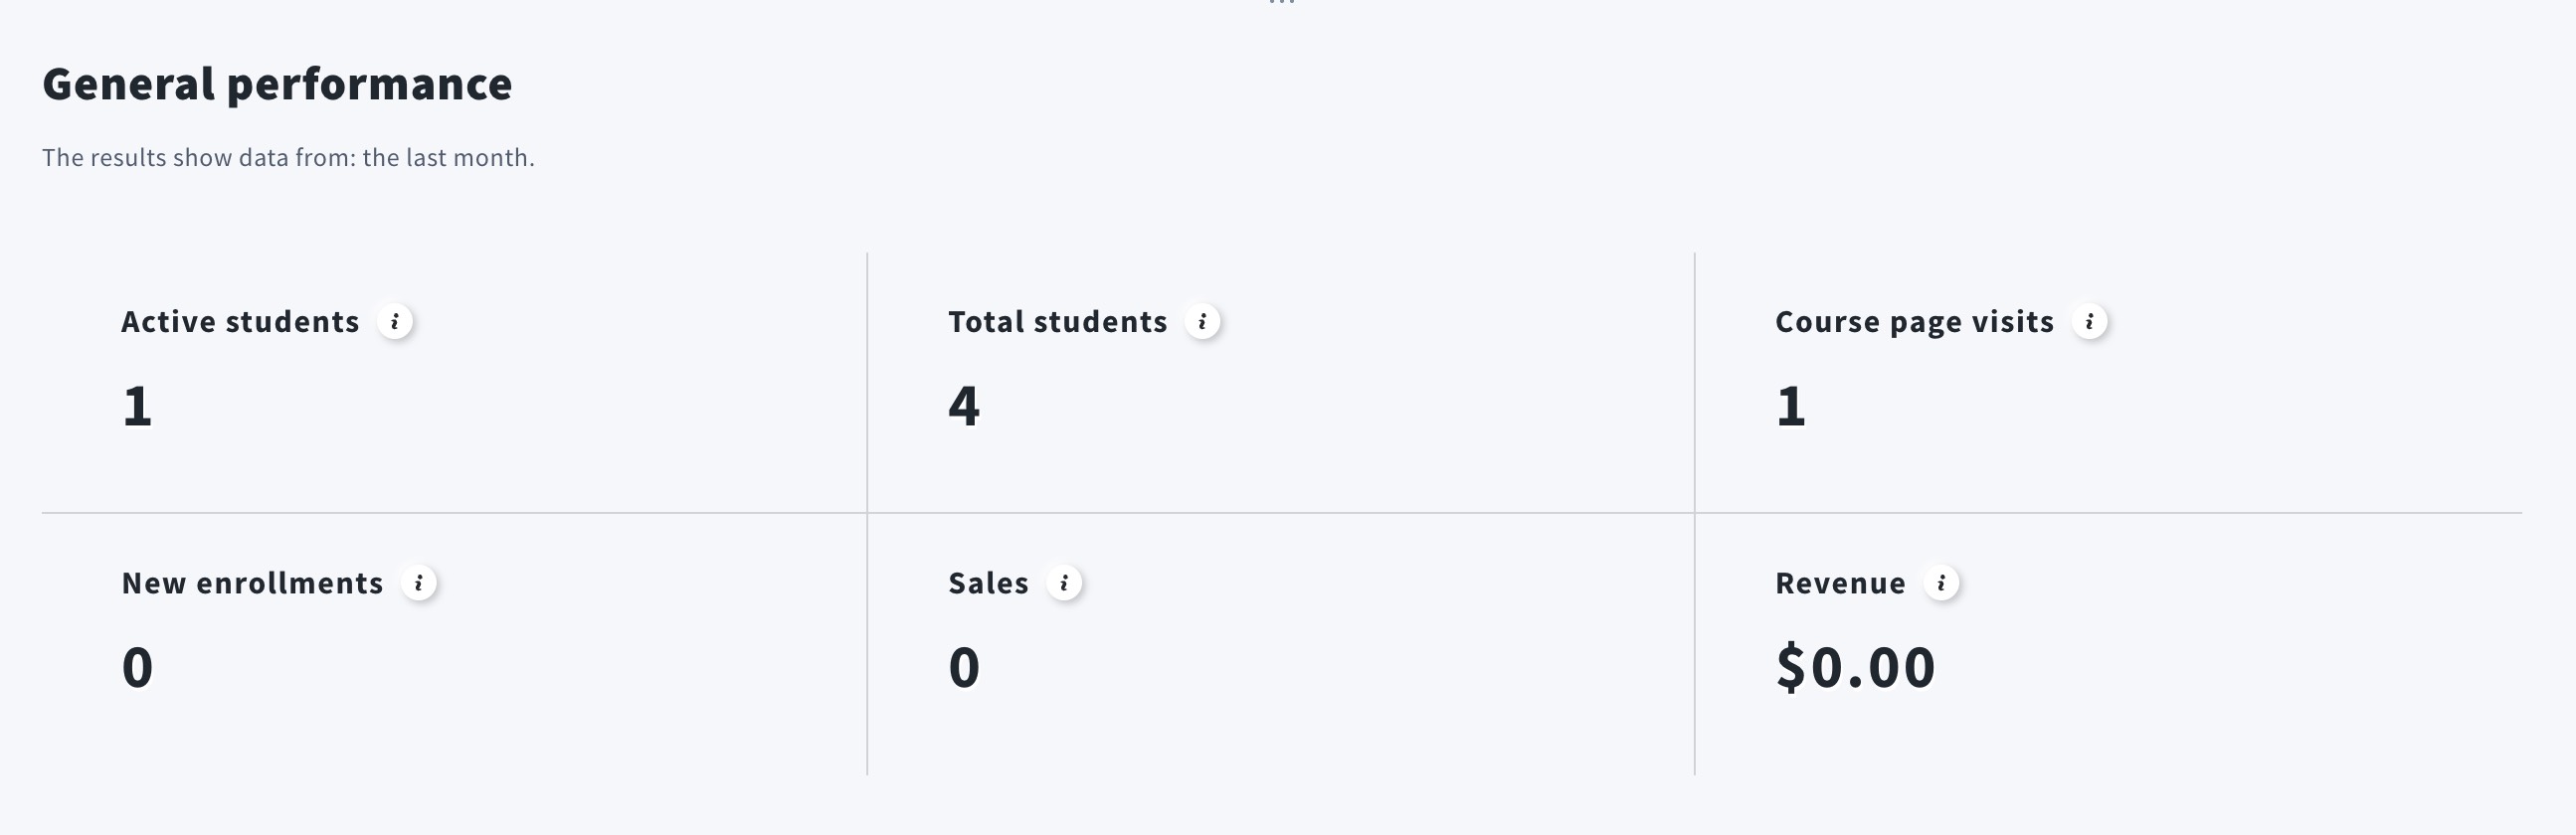
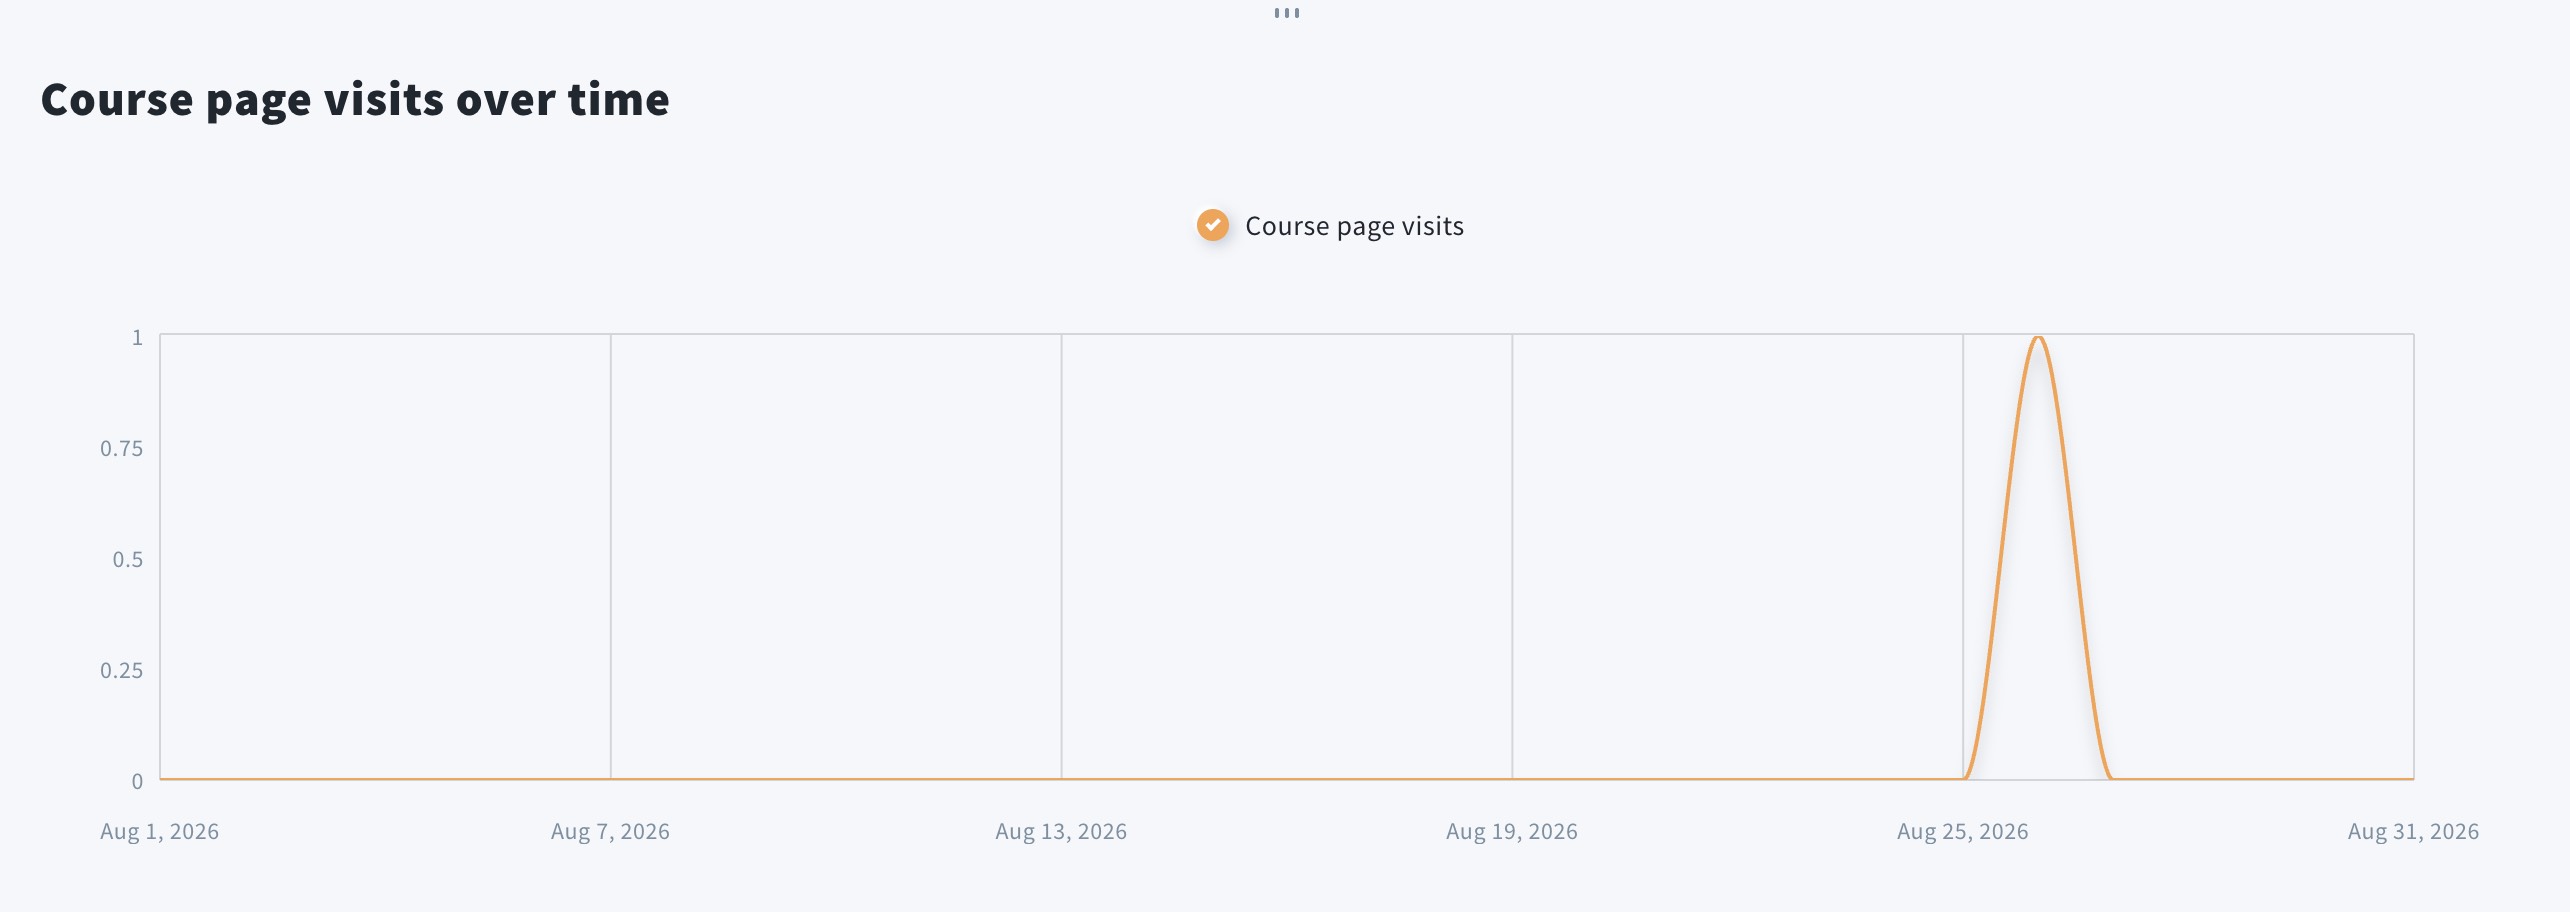
- Below you will find charts with course page visits, enrollment and conversion, sales and conversion, and revenue over time.
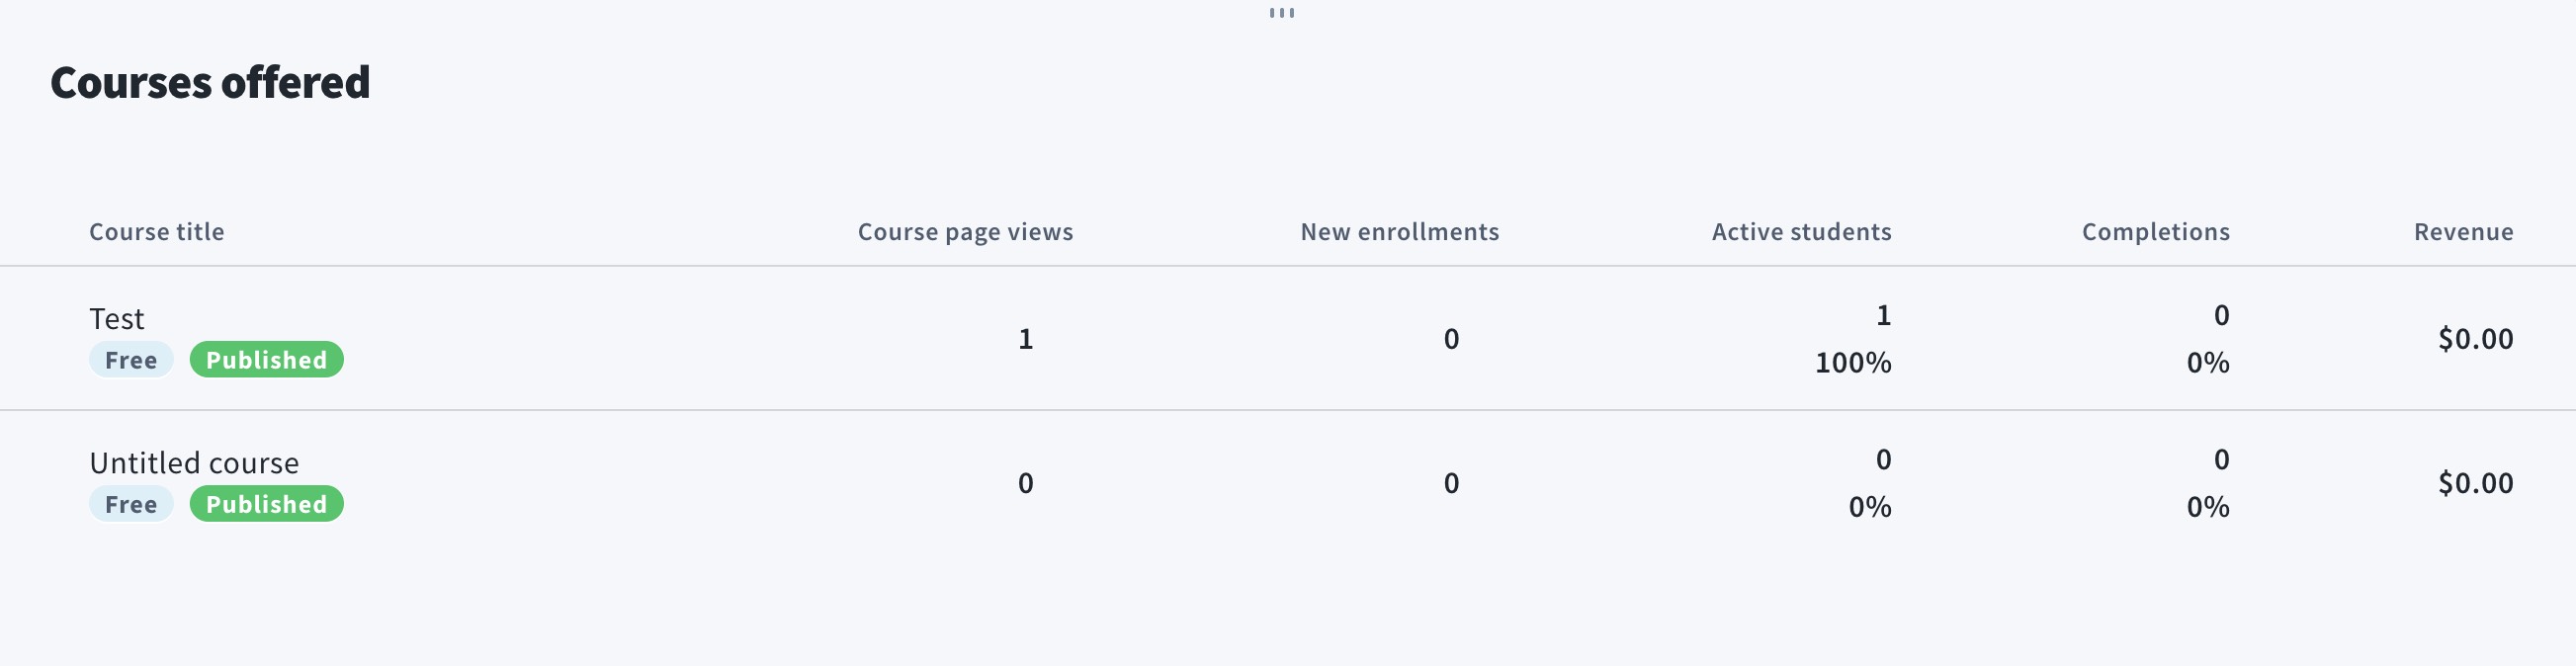
- Courses offered: here you can see a list of your courses, including their pricing (free or paid) and publication status. You can also see course page views, new enrollments, active students, completions, and revenue for each course.